


Draw the graph of the line, \[y = 2x\].
Answer
546.6k+ views
Hint:
In this question, we need to plot the graph for the given line \[y = 2x\]. For this, we will put different values of x and y and mark the different values of (\[x\],\[y\]\[)\]as a point and plot the graph.
Complete step by step solution:
We need to draw the graph of \[y = 2x\]. For this we will use the simple method in which we will be taking different values of x and find the corresponding value of y.
Minimum two points are needed to draw a graph but we will take at least 3 points to be sure that the point obtained by is correct.
Now let us find the points,
When \[x\] = 1, then \[y\]= 2 [\[y\]= 2\[ \times \]1= 2 ]
When \[x\] = 2, then \[y\]= 4 [\[y\]= 2\[ \times \]2= 4 ]
When \[x\] = -1, then \[y\]= 4 [\[y\]= 2\[ \times \]-1= -2]
So,
We have got three points which are (1,2), (2,4), (-1,-2)
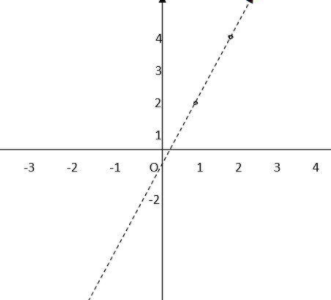
Marking all the three points in the graph paper and drawing a straight line such that the line touches all the three points.
Hence, the graph is formed.
Additional Information: Whenever there is a linear equation a straight line is only formed so we need not to go for any curve in such cases.
Note: There are several manners where students make errors, First in finding the points \[x\] and \[y\]. Even after finding we need to put great care while plotting the points. If the points are wrongly placed it will not form a straight line and hence the graph will be wrong.
In this question, we need to plot the graph for the given line \[y = 2x\]. For this, we will put different values of x and y and mark the different values of (\[x\],\[y\]\[)\]as a point and plot the graph.
Complete step by step solution:
We need to draw the graph of \[y = 2x\]. For this we will use the simple method in which we will be taking different values of x and find the corresponding value of y.
Minimum two points are needed to draw a graph but we will take at least 3 points to be sure that the point obtained by is correct.
Now let us find the points,
When \[x\] = 1, then \[y\]= 2 [\[y\]= 2\[ \times \]1= 2 ]
When \[x\] = 2, then \[y\]= 4 [\[y\]= 2\[ \times \]2= 4 ]
When \[x\] = -1, then \[y\]= 4 [\[y\]= 2\[ \times \]-1= -2]
| \[x\] | 1 | 2 | 1 |
| \[y\] | 2 | 4 | 2 |
So,
We have got three points which are (1,2), (2,4), (-1,-2)
Marking all the three points in the graph paper and drawing a straight line such that the line touches all the three points.
Hence, the graph is formed.
Additional Information: Whenever there is a linear equation a straight line is only formed so we need not to go for any curve in such cases.
Note: There are several manners where students make errors, First in finding the points \[x\] and \[y\]. Even after finding we need to put great care while plotting the points. If the points are wrongly placed it will not form a straight line and hence the graph will be wrong.
Recently Updated Pages
Master Class 11 Computer Science: Engaging Questions & Answers for Success
Master Class 11 Business Studies: Engaging Questions & Answers for Success
Master Class 11 Economics: Engaging Questions & Answers for Success
Master Class 11 English: Engaging Questions & Answers for Success
Master Class 11 Maths: Engaging Questions & Answers for Success
Master Class 11 Biology: Engaging Questions & Answers for Success
Trending doubts
One Metric ton is equal to kg A 10000 B 1000 C 100 class 11 physics CBSE
There are 720 permutations of the digits 1 2 3 4 5 class 11 maths CBSE
Discuss the various forms of bacteria class 11 biology CBSE
Draw a diagram of a plant cell and label at least eight class 11 biology CBSE
State the laws of reflection of light
Explain zero factorial class 11 maths CBSE