


Draw the graph of the inequality \[x < 0\]?
Answer
558.6k+ views
Hint:For any inequality when you are solving you should know the sign of inequality changes when you multiply minus sign both the side, and rest solution can be done same as that for equals sign is done, nor any other assumption should be needed. In case of graphs you should know that graphs give a region of space in the coordinate axis where the function given satisfies every value of that space.
Complete step by step solution:
For the given inequality \[x < 0\]
The graph obtained will specify the region in which every value of “x” is negative, so plotting graph between “x” and “y” axis we get,
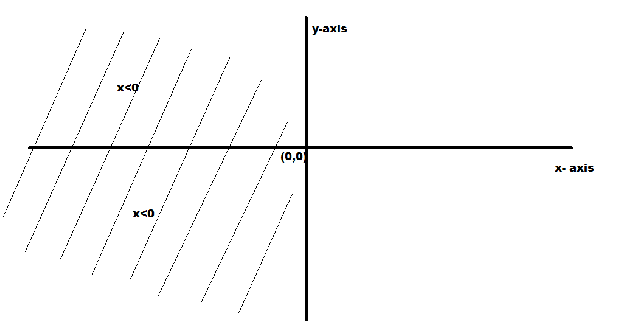
The above left part from the “y”axis region in the graph shows the defined region for our inequality.
Additional Information: If you are given the equals to sign with inequalities then also the process would be same the only change would be in describing the range of the quantity, that is closed bracket would be used instead of an open bracket.
Note: Inequality basically defines the region of the quantity whosoever for which the inequality is used for, that is it gives you a range of possible values for the quantity you are finding for. In this range real as well as complex range also occurs. In graphs you should the region you are dealing with and for confirming your solution you can check for any value in the region of the graph that it will satisfy the equation.
Complete step by step solution:
For the given inequality \[x < 0\]
The graph obtained will specify the region in which every value of “x” is negative, so plotting graph between “x” and “y” axis we get,
The above left part from the “y”axis region in the graph shows the defined region for our inequality.
Additional Information: If you are given the equals to sign with inequalities then also the process would be same the only change would be in describing the range of the quantity, that is closed bracket would be used instead of an open bracket.
Note: Inequality basically defines the region of the quantity whosoever for which the inequality is used for, that is it gives you a range of possible values for the quantity you are finding for. In this range real as well as complex range also occurs. In graphs you should the region you are dealing with and for confirming your solution you can check for any value in the region of the graph that it will satisfy the equation.
Recently Updated Pages
Master Class 11 Computer Science: Engaging Questions & Answers for Success
Master Class 11 Business Studies: Engaging Questions & Answers for Success
Master Class 11 Economics: Engaging Questions & Answers for Success
Master Class 11 English: Engaging Questions & Answers for Success
Master Class 11 Maths: Engaging Questions & Answers for Success
Master Class 11 Biology: Engaging Questions & Answers for Success
Trending doubts
One Metric ton is equal to kg A 10000 B 1000 C 100 class 11 physics CBSE
There are 720 permutations of the digits 1 2 3 4 5 class 11 maths CBSE
Discuss the various forms of bacteria class 11 biology CBSE
Draw a diagram of a plant cell and label at least eight class 11 biology CBSE
State the laws of reflection of light
Explain zero factorial class 11 maths CBSE