


Draw the graph of the following equation: $ y = 3 - 4x $ .
Answer
584.1k+ views
Hint: We are given a linear equation here in the question and we are supposed to draw the graph of the equation. For that we take a random value of one variable and get the value of another variable and doing this we get certain points and with help of these we plot the line in the Cartesian plane.
Complete step-by-step answer:
Firstly we write down the given linear equation i.e.
$ y = 3 - 4x $
Before drawing a graph we look at the equation carefully and after observing this we understand that the graph of the equation will be a straight line (linear equation is an equation of line).
We simply have to solve this equation for different values of ‘x’ and ‘y’ and by doing so we get three or four points and with help of these points we will be able to draw the graph easily.
So we put three values of x and y shown in the below table:
$ y = 3 - 4x $
When x=0 ,
$ y = 3 - 4(0) $
$ y = 3 $
when x=1
$ y = 3 - 4(1) $
$ y = 3 - 4 $
$ y=-1 $
$ y = 3 - 4x $
$ y = 3 - 4(2) $
$ y = 3 - 8 $
$ y = -5 $
Now using these points we draw a graph in the Cartesian plane as shown in the figure below
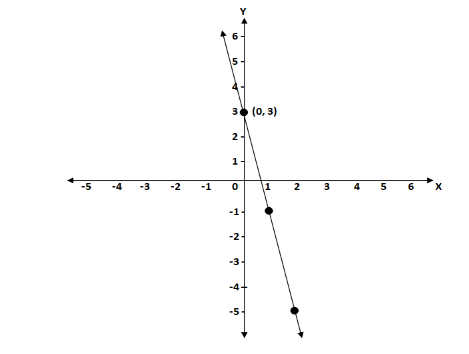
This is the required graph of the given equation which we have drawn using three points i.e. (0, 3), (1,-1) and (2,-5) in the Cartesian plane.
Note: We have two variables in this equation because the Cartesian plane consists of two axes i.e. x-axis and y-axis so we represent points using values of ‘x’ and ‘y’ and with this we can draw all two dimensional figures using this method.
Complete step-by-step answer:
Firstly we write down the given linear equation i.e.
$ y = 3 - 4x $
Before drawing a graph we look at the equation carefully and after observing this we understand that the graph of the equation will be a straight line (linear equation is an equation of line).
We simply have to solve this equation for different values of ‘x’ and ‘y’ and by doing so we get three or four points and with help of these points we will be able to draw the graph easily.
So we put three values of x and y shown in the below table:
$ y = 3 - 4x $
When x=0 ,
$ y = 3 - 4(0) $
$ y = 3 $
when x=1
$ y = 3 - 4(1) $
$ y = 3 - 4 $
$ y=-1 $
$ y = 3 - 4x $
$ y = 3 - 4(2) $
$ y = 3 - 8 $
$ y = -5 $
| X | 0 | 1 | 2 |
| Y | 3 | -1 | -5 |
Now using these points we draw a graph in the Cartesian plane as shown in the figure below
This is the required graph of the given equation which we have drawn using three points i.e. (0, 3), (1,-1) and (2,-5) in the Cartesian plane.
Note: We have two variables in this equation because the Cartesian plane consists of two axes i.e. x-axis and y-axis so we represent points using values of ‘x’ and ‘y’ and with this we can draw all two dimensional figures using this method.
Recently Updated Pages
Master Class 12 Business Studies: Engaging Questions & Answers for Success
Master Class 12 Biology: Engaging Questions & Answers for Success
Master Class 12 Chemistry: Engaging Questions & Answers for Success
Class 12 Question and Answer - Your Ultimate Solutions Guide
Master Class 11 Social Science: Engaging Questions & Answers for Success
Master Class 11 English: Engaging Questions & Answers for Success
Trending doubts
What is BLO What is the full form of BLO class 8 social science CBSE
Citizens of India can vote at the age of A 18 years class 8 social science CBSE
Right to vote is a AFundamental Right BFundamental class 8 social science CBSE
Name the states through which the Tropic of Cancer class 8 social science CBSE
Give me the opposite gender of Duck class 8 english CBSE
What are the 12 elements of nature class 8 chemistry CBSE