


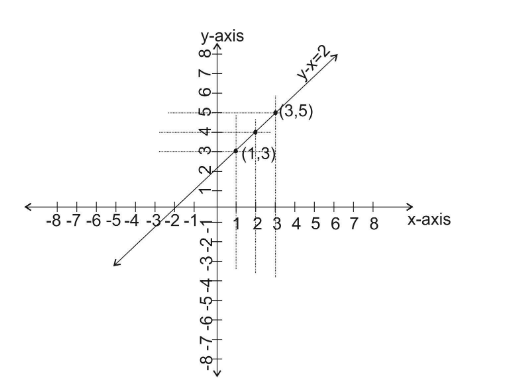
Draw the graph of the equation $ y - x = 2 $ .
Answer
606.9k+ views
Hint: To draw a graph of a linear equation. We first assume some value of either of the variables and then using these values on substituting in the given linear equation we calculate the values of other variables and then plotting these points in x-y plane we will have a required graph of the given equation.
Complete step-by-step answer:
To draw a graph of a linear equation. We first assume some value of either of the variables and then using these values on substituting in the given linear equation we calculate the values of other variables.
Then plotting these values of ‘x’ and ‘y’ on the x-y plane.
Joining of these plotted points gives a graph of the given linear equation.
We first let different values of ‘x’. Which are
For $ x = 1 $ , on substituting in $ y - x = 2 $ we have
$
y - 1 = 2 \\
\Rightarrow y = 2 + 1 \\
\Rightarrow y = 3 \;
$
Therefore, for $ x = 1 $ we have $ y = 3 $
For, on substituting in $ y - x = 2 $ we have
$
y - 2 = 2 \\
\Rightarrow y = 2 + 2 \\
\Rightarrow y = 4 \;
$
Therefore, for $ x = 2 $ we have $ y = 4 $
For, on substituting in $ y - x = 2 $ we have
$
y - 3 = 2 \\
\Rightarrow y = 2 + 3 \\
\Rightarrow y = 5 \;
$
Therefore, $ x = 3 $ for we have $ y = 5 $
Note: Graph of a linear equation is always a straight line. If while calculating points if someone has made a mistake then all the points obtained after calculations will not come on a straight line. So, one should do calculation carefully while doing calculation for points and also while plotting in x-y plane.
Complete step-by-step answer:
To draw a graph of a linear equation. We first assume some value of either of the variables and then using these values on substituting in the given linear equation we calculate the values of other variables.
Then plotting these values of ‘x’ and ‘y’ on the x-y plane.
Joining of these plotted points gives a graph of the given linear equation.
We first let different values of ‘x’. Which are
For $ x = 1 $ , on substituting in $ y - x = 2 $ we have
$
y - 1 = 2 \\
\Rightarrow y = 2 + 1 \\
\Rightarrow y = 3 \;
$
Therefore, for $ x = 1 $ we have $ y = 3 $
For, on substituting in $ y - x = 2 $ we have
$
y - 2 = 2 \\
\Rightarrow y = 2 + 2 \\
\Rightarrow y = 4 \;
$
Therefore, for $ x = 2 $ we have $ y = 4 $
For, on substituting in $ y - x = 2 $ we have
$
y - 3 = 2 \\
\Rightarrow y = 2 + 3 \\
\Rightarrow y = 5 \;
$
Therefore, $ x = 3 $ for we have $ y = 5 $
| x | 1 | 2 | 3 |
| y | 3 | 4 | 5 |
Note: Graph of a linear equation is always a straight line. If while calculating points if someone has made a mistake then all the points obtained after calculations will not come on a straight line. So, one should do calculation carefully while doing calculation for points and also while plotting in x-y plane.
Recently Updated Pages
Master Class 11 Social Science: Engaging Questions & Answers for Success
Master Class 11 Chemistry: Engaging Questions & Answers for Success
Master Class 12 Business Studies: Engaging Questions & Answers for Success
Master Class 12 Chemistry: Engaging Questions & Answers for Success
Master Class 12 Biology: Engaging Questions & Answers for Success
Class 12 Question and Answer - Your Ultimate Solutions Guide
Trending doubts
What is BLO What is the full form of BLO class 8 social science CBSE
Citizens of India can vote at the age of A 18 years class 8 social science CBSE
Right to vote is a AFundamental Right BFundamental class 8 social science CBSE
Give me the opposite gender of Duck class 8 english CBSE
Full form of STD, ISD and PCO
Explain land use pattern in India and why has the land class 8 social science CBSE