


Draw the graph of following linear equation in two variables:
\[x+y=4\]
Answer
575.7k+ views
Hint: We solve this problem by creating the table of co – ordinates of points that satisfy the given equation. We take the values of \['x'\] from ‘-3’ to ‘3’ and find the corresponding values of \['y'\] to get the co – ordinates of points as \[\left( x,y \right)\] then we consider certain scale of graph and draw the graph using the points.
Complete step-by-step answer:
We are given that the equation of line as
\[\begin{align}
& \Rightarrow x+y=4 \\
& \Rightarrow y=4-x \\
\end{align}\]
Let us take the range of \['x'\] from ‘-3’ to ‘3’ and find the corresponding values of \['y'\]
So, for x = -3, we can find y as y = 4 - (-3) = 4 + 3 = 7. Similarly, we will find all other values.
Let us create a table of these values as follows
Now, let us assume the scale of graph as
On X – axis \[1cm=1unit\]
On Y – axis \[1cm=1unit\]
By using the above scale and co – ordinates of points let us draw the graph then we get
Therefore the graph of the given equation \[x+y=4\] has been completed.
Note: We can draw the graph using some short cut without finding all the co – ordinates.
We find the intercepts that is x – intercept and y – intercept to draw the graph easily.
The x – intercept is calculated by taking \[y=0\]
We are given that the equation of line as
\[\Rightarrow x+y=4\]
By substituting \[y=0\] in given equation we get the x – intercept as
\[\begin{align}
& \Rightarrow x+0=4 \\
& \Rightarrow x=4 \\
\end{align}\]
Similarly, we can find the y – intercept by taking \[x=0\]
By substituting \[x=0\] in given equation we get the y – intercept as
\[\begin{align}
& \Rightarrow 0+y=4 \\
& \Rightarrow y=4 \\
\end{align}\]
By pointing the x – intercept and y – intercept in graph and joining the points we get the graph as
Here, also we get the same graph but some other part of graph. But, both are same.
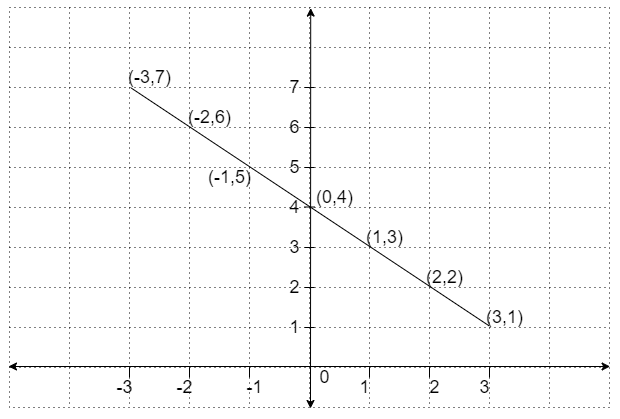
Complete step-by-step answer:
We are given that the equation of line as
\[\begin{align}
& \Rightarrow x+y=4 \\
& \Rightarrow y=4-x \\
\end{align}\]
Let us take the range of \['x'\] from ‘-3’ to ‘3’ and find the corresponding values of \['y'\]
So, for x = -3, we can find y as y = 4 - (-3) = 4 + 3 = 7. Similarly, we will find all other values.
Let us create a table of these values as follows
| \[x\] | -3 | -2 | -1 | 0 | 1 | 2 | 3 |
| \[y\] | 7 | 6 | 5 | 4 | 3 | 2 | 1 |
| \[\left( x,y \right)\] | \[\left( 3,7 \right)\] | \[\left( -2,6 \right)\] | \[\left( -1,5 \right)\] | \[\left( 0,4 \right)\] | \[\left( 1,3 \right)\] | \[\left( 2,2 \right)\] | \[\left( 3,1 \right)\] |
Now, let us assume the scale of graph as
On X – axis \[1cm=1unit\]
On Y – axis \[1cm=1unit\]
By using the above scale and co – ordinates of points let us draw the graph then we get
Therefore the graph of the given equation \[x+y=4\] has been completed.
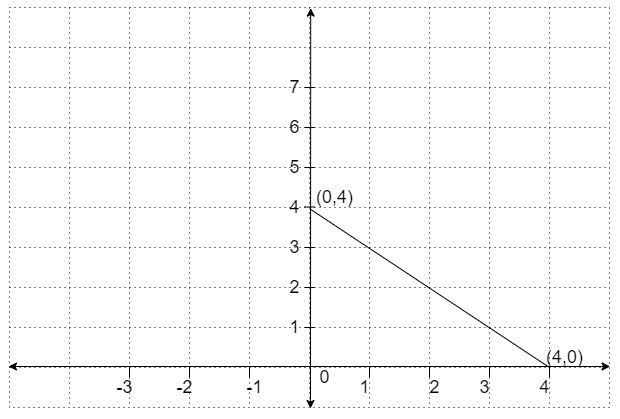
Note: We can draw the graph using some short cut without finding all the co – ordinates.
We find the intercepts that is x – intercept and y – intercept to draw the graph easily.
The x – intercept is calculated by taking \[y=0\]
We are given that the equation of line as
\[\Rightarrow x+y=4\]
By substituting \[y=0\] in given equation we get the x – intercept as
\[\begin{align}
& \Rightarrow x+0=4 \\
& \Rightarrow x=4 \\
\end{align}\]
Similarly, we can find the y – intercept by taking \[x=0\]
By substituting \[x=0\] in given equation we get the y – intercept as
\[\begin{align}
& \Rightarrow 0+y=4 \\
& \Rightarrow y=4 \\
\end{align}\]
By pointing the x – intercept and y – intercept in graph and joining the points we get the graph as
Here, also we get the same graph but some other part of graph. But, both are same.

Recently Updated Pages
Master Class 8 Social Science: Engaging Questions & Answers for Success
Master Class 8 English: Engaging Questions & Answers for Success
Class 8 Question and Answer - Your Ultimate Solutions Guide
Master Class 8 Maths: Engaging Questions & Answers for Success
Master Class 8 Science: Engaging Questions & Answers for Success
Master Class 9 General Knowledge: Engaging Questions & Answers for Success
Trending doubts
What is BLO What is the full form of BLO class 8 social science CBSE
Citizens of India can vote at the age of A 18 years class 8 social science CBSE
Full form of STD, ISD and PCO
Advantages and disadvantages of science
Right to vote is a AFundamental Right BFundamental class 8 social science CBSE
What are the 12 elements of nature class 8 chemistry CBSE