


Draw the graph for the following values, with suitable scale on the axis.
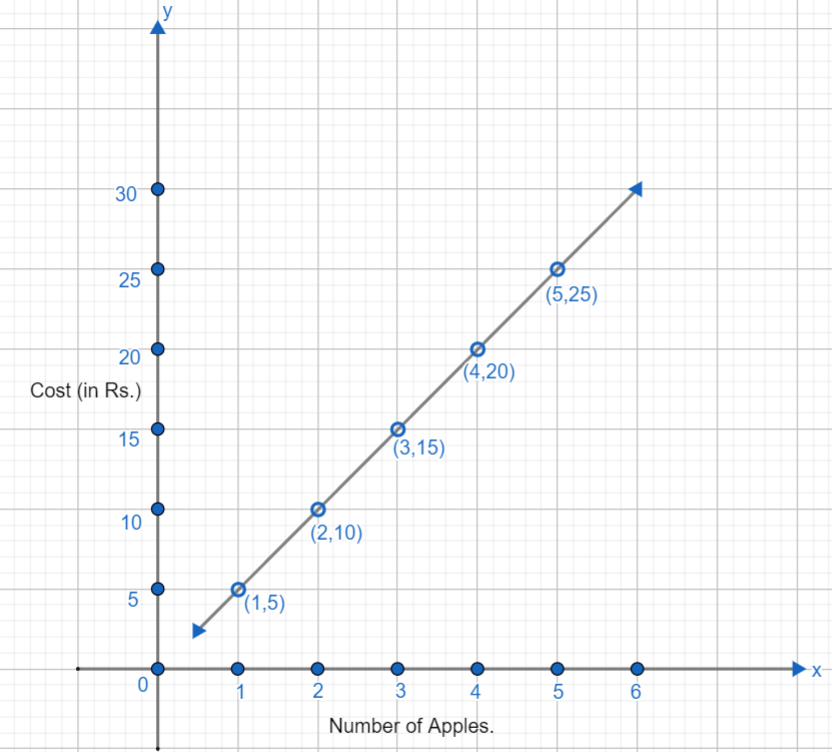
(a) Cost of apples.
Number of Apples 1 2 3 4 5 Cost (in Rs.) 5 10 15 20 25
(b) Distance travelled by car.
Time (in hours) 6am 7am 8am 9am Distance (in Km.) 40 80 120 160
(i) How much distance did the car cover during the period 7.30 am to 8 am?
(ii) What was the time when the car had covered a distance of 100 km since its start?
(c) Interest on deposit for a year.
Deposit (in Rs.) 1000 2000 3000 4000 5000 Simple Interest (in Rs.) 80 160 240 320 400
(i) Does the graph pass through the origin?
(ii) Use the graph to find the interest on Rs. 2500 for a year.
(iii) To get an interest of Rs.280 per year, how much money should be deposited?
| Number of Apples | 1 | 2 | 3 | 4 | 5 |
| Cost (in Rs.) | 5 | 10 | 15 | 20 | 25 |
| Time (in hours) | 6am | 7am | 8am | 9am |
| Distance (in Km.) | 40 | 80 | 120 | 160 |
| Deposit (in Rs.) | 1000 | 2000 | 3000 | 4000 | 5000 |
| Simple Interest (in Rs.) | 80 | 160 | 240 | 320 | 400 |
Answer
615.9k+ views
Hint: In this question, we have to draw graphs for three parts.
For (a), we will take a number of apples on the x axis with a scale of 1 apple for 1 unit and we will take cost (in Rs.) on y axis with a scale of Rs.5 for 1 unit.
For (b), we will take time on the x axis with value starting from 6 am and take one hour for every unit. We will take distance on y axis with a scale of 40 km for 1 unit. Using the graph drawn, we will answer given two sub parts.
For (c), we will take a deposit on the x axis with a scale of Rs.500 for 1 unit and we will take a simple interest on y axis with scale of Rs.40 for 1 unit. Using the graph drawn, we will answer the given sub parts.
Complete step by step answer:
Let us draw graph for (a) first,
We will take a number of apples on the x axis with a scale of 1 apple for 1 unit and we will take cost (in Rs.) on y axis with a scale of Rs.5 for 1 unit. Coordinates become:
(1,5), (2,10), (3,15), (4,20), (5,25)
Now, let us draw graph for (b),
We will take time on the x axis with value starting from 6 am and take one hour for every unit. We will take distance on y axis with a scale of 40 km for 1 unit. Coordinates become:
(6,40), (7,80), (8,120), (9,160)
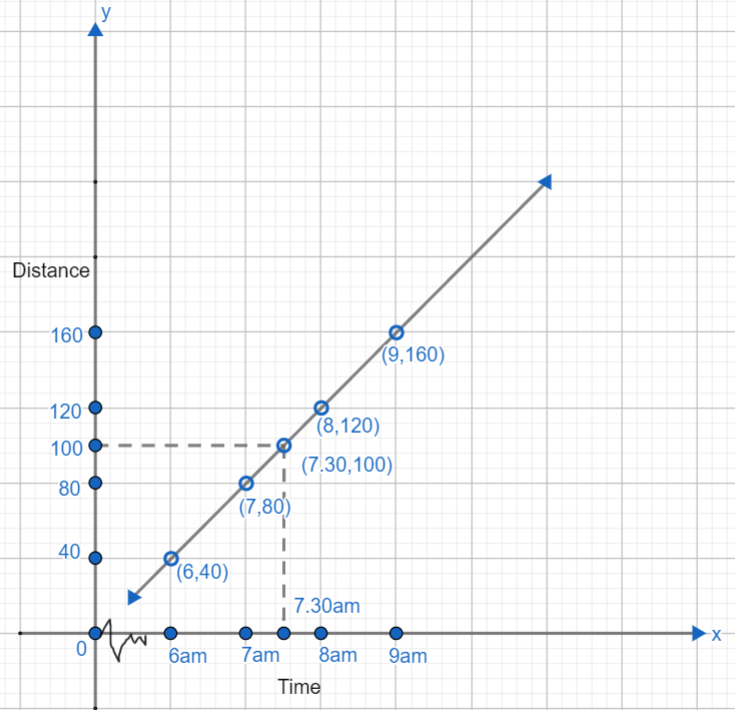
We have to calculate the distance covered during 7.30 and 8 am. As we know, distance covered at 8 am is given as 120. From the graph, draw a line from 7.30 am to the line joining coordinates, from there we see that it corresponds to 100km on y axis. Hence, the distance covered at 7.30 am is 100 km.
Distance covered between 7.30 am and 8 am = Distance at 8 am - Distance at 7.30 am.
Distance covered between 7.30 am and 8 am = 120 – 100 = 20 Km.
(i) Distance covered between 7.30 am to 8 am is 20 km.
(ii) As we have seen in the previous part that at 7.30 am, 100 km distance was covered. So, at 7.30 am the car covered 100 km distance.
Now, let us draw a graph for (c). Coordinates become:
(1000,80), (2000,160), (3000,240), (4000,320), (5000,400)
We will take a deposit on the x axis with a scale of Rs.500 as 1 unit and simple interest on the y axis with a scale of Rs.40 as 1 unit.
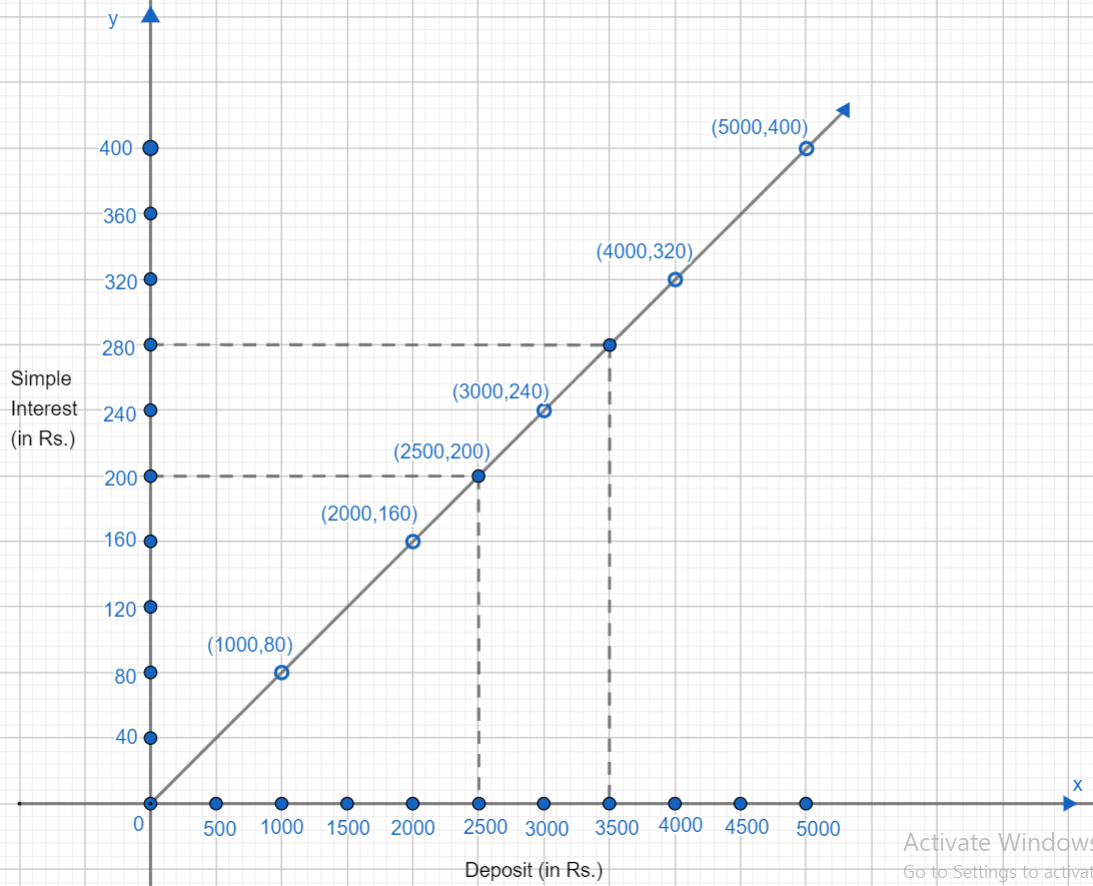
Let us solve sub parts using graph:
(i) As we can clearly see from the graph, the line joining coordinates passes through origin.
(ii) For Rs.2500 on x axis, draw line from x axis to the line joining coordinate, we get that Rs.200 on y axis corresponds to the value of Rs.2500 on x axis. Hence, interest on Rs.2500 is Rs.200
(iii) For Rs.280 on y axis, draw line from y axis to line joining coordinate, we get that Rs.3500 on x axis corresponding to the value of Rs.280 on y axis.
Hence, we get interest of Rs.280, we should deposit Rs.3500
Note: Students should carefully draw graphs by taking proper scale on x axis and y axis. Don't forget to write quantities taken on x axis and y axis. Students can take different scales also, such as for (b) they can take a scale of 20 km as 1 unit on y axis. While calculating values from the graph, make sure that you draw perpendicular lines.
For (a), we will take a number of apples on the x axis with a scale of 1 apple for 1 unit and we will take cost (in Rs.) on y axis with a scale of Rs.5 for 1 unit.
For (b), we will take time on the x axis with value starting from 6 am and take one hour for every unit. We will take distance on y axis with a scale of 40 km for 1 unit. Using the graph drawn, we will answer given two sub parts.
For (c), we will take a deposit on the x axis with a scale of Rs.500 for 1 unit and we will take a simple interest on y axis with scale of Rs.40 for 1 unit. Using the graph drawn, we will answer the given sub parts.
Complete step by step answer:
Let us draw graph for (a) first,
We will take a number of apples on the x axis with a scale of 1 apple for 1 unit and we will take cost (in Rs.) on y axis with a scale of Rs.5 for 1 unit. Coordinates become:
(1,5), (2,10), (3,15), (4,20), (5,25)
Now, let us draw graph for (b),
We will take time on the x axis with value starting from 6 am and take one hour for every unit. We will take distance on y axis with a scale of 40 km for 1 unit. Coordinates become:
(6,40), (7,80), (8,120), (9,160)
We have to calculate the distance covered during 7.30 and 8 am. As we know, distance covered at 8 am is given as 120. From the graph, draw a line from 7.30 am to the line joining coordinates, from there we see that it corresponds to 100km on y axis. Hence, the distance covered at 7.30 am is 100 km.
Distance covered between 7.30 am and 8 am = Distance at 8 am - Distance at 7.30 am.
Distance covered between 7.30 am and 8 am = 120 – 100 = 20 Km.
(i) Distance covered between 7.30 am to 8 am is 20 km.
(ii) As we have seen in the previous part that at 7.30 am, 100 km distance was covered. So, at 7.30 am the car covered 100 km distance.
Now, let us draw a graph for (c). Coordinates become:
(1000,80), (2000,160), (3000,240), (4000,320), (5000,400)
We will take a deposit on the x axis with a scale of Rs.500 as 1 unit and simple interest on the y axis with a scale of Rs.40 as 1 unit.
Let us solve sub parts using graph:
(i) As we can clearly see from the graph, the line joining coordinates passes through origin.
(ii) For Rs.2500 on x axis, draw line from x axis to the line joining coordinate, we get that Rs.200 on y axis corresponds to the value of Rs.2500 on x axis. Hence, interest on Rs.2500 is Rs.200
(iii) For Rs.280 on y axis, draw line from y axis to line joining coordinate, we get that Rs.3500 on x axis corresponding to the value of Rs.280 on y axis.
Hence, we get interest of Rs.280, we should deposit Rs.3500
Note: Students should carefully draw graphs by taking proper scale on x axis and y axis. Don't forget to write quantities taken on x axis and y axis. Students can take different scales also, such as for (b) they can take a scale of 20 km as 1 unit on y axis. While calculating values from the graph, make sure that you draw perpendicular lines.
Recently Updated Pages
Master Class 11 English: Engaging Questions & Answers for Success
Master Class 11 Social Science: Engaging Questions & Answers for Success
Master Class 11 Maths: Engaging Questions & Answers for Success
Master Class 11 Biology: Engaging Questions & Answers for Success
Master Class 11 Physics: Engaging Questions & Answers for Success
Master Class 11 Chemistry: Engaging Questions & Answers for Success
Trending doubts
Explain the Treaty of Vienna of 1815 class 10 social science CBSE
What is the full form of POSCO class 10 social science CBSE
Define Potential, Developed, Stock and Reserved resources
The diagonals of a rhombus are 10cm and 24cm Find the class 10 maths CBSE
One number is chosen from numbers 1 to 200 Find the class 10 maths CBSE
Why is Venus called Earths sister planet class 10 physics CBSE