


Draw the graph for the following linear equations
i) \[y = 4\]
ii) \[x = - 2\]
iii) \[2x - 4 = 0\]
iv) \[6 + 2y = 0\]
v) \[9 - 3x = 0\]
Answer
613.8k+ views
Hint: In the given question, each linear equation is of a single variable so it will be easy to plot the graph according to the values that given if there are two variables then we need to assume the values of each variable and then we have to plot the values. For the question iii) and v) we have to find the value of x by sending the numbers Right hand side. For the question iv), we have to find the value of y by sending the values to the right hand side.
Complete step-by-step answer:
The total five sub parts belong to a single question so we can plot all equations in a single graph. Firstly, we will find the values of x and y in each equation, they are as follows.
I.\[y = 4\]
In this question, it is given directly the value of y, so we can plot the graph.
II.\[x = - 2\]
In this question, it is given directly the value of x, so we can plot the graph.
III.\[2x - 4 = 0\]
In this, we have to find the value of x, then
\[
\Rightarrow 2x - 4 = 0\\
\Rightarrow x = \dfrac{4}{2}\\
\Rightarrow x = 2
\]
Then the value of x is 2.
IV.\[6 + 2y = 0\]
In this, we have to find the value of y, then
\[
\Rightarrow 6 + 2y = 0\\
\Rightarrow y = \dfrac{{ - 6}}{2}\\
\Rightarrow y = - 3
\]
Then the value of y is -3.
V.\[9 - 3x = 0\]
The value x will be
\[
\Rightarrow 9 - 3x = 0\\
\Rightarrow x = \dfrac{9}{3}\\
\Rightarrow x = 3
\]
Therefore, the value of x is 3.
Now, according to the values we got, the graph can be drawn.
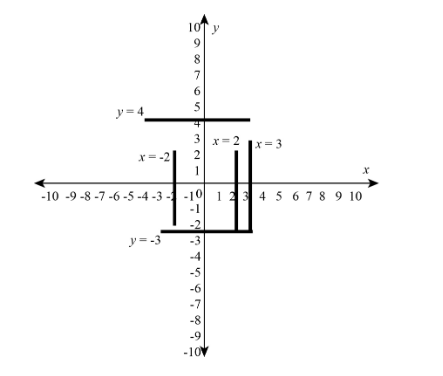
Note: Here, we may be confused about how to plot the graph because there is only one variable in each equation, whereas there will be two variables in the graph x-axis and y-axis. So we have to assume the unknown variable as the zero and plot the graph. If the equation has only x variable and no y variable, then assume y as zero and plot the graph according to it.
Complete step-by-step answer:
The total five sub parts belong to a single question so we can plot all equations in a single graph. Firstly, we will find the values of x and y in each equation, they are as follows.
I.\[y = 4\]
In this question, it is given directly the value of y, so we can plot the graph.
II.\[x = - 2\]
In this question, it is given directly the value of x, so we can plot the graph.
III.\[2x - 4 = 0\]
In this, we have to find the value of x, then
\[
\Rightarrow 2x - 4 = 0\\
\Rightarrow x = \dfrac{4}{2}\\
\Rightarrow x = 2
\]
Then the value of x is 2.
IV.\[6 + 2y = 0\]
In this, we have to find the value of y, then
\[
\Rightarrow 6 + 2y = 0\\
\Rightarrow y = \dfrac{{ - 6}}{2}\\
\Rightarrow y = - 3
\]
Then the value of y is -3.
V.\[9 - 3x = 0\]
The value x will be
\[
\Rightarrow 9 - 3x = 0\\
\Rightarrow x = \dfrac{9}{3}\\
\Rightarrow x = 3
\]
Therefore, the value of x is 3.
Now, according to the values we got, the graph can be drawn.
Note: Here, we may be confused about how to plot the graph because there is only one variable in each equation, whereas there will be two variables in the graph x-axis and y-axis. So we have to assume the unknown variable as the zero and plot the graph. If the equation has only x variable and no y variable, then assume y as zero and plot the graph according to it.

Recently Updated Pages
Master Class 8 English: Engaging Questions & Answers for Success
Master Class 8 Science: Engaging Questions & Answers for Success
Master Class 8 Maths: Engaging Questions & Answers for Success
Class 8 Question and Answer - Your Ultimate Solutions Guide
Master Class 8 Social Science: Engaging Questions & Answers for Success
Master Class 9 General Knowledge: Engaging Questions & Answers for Success
Trending doubts
What is BLO What is the full form of BLO class 8 social science CBSE
Citizens of India can vote at the age of A 18 years class 8 social science CBSE
Right to vote is a AFundamental Right BFundamental class 8 social science CBSE
Give me the opposite gender of Duck class 8 english CBSE
Full form of STD, ISD and PCO
Explain land use pattern in India and why has the land class 8 social science CBSE