


Draw the graph and find the roots of $ y = {x^2} + 2 $ .
Answer
609.3k+ views
Hint: We can draw a graph of given curve by either writing it in standard form of parabola or taking different values of ‘x’ then finding corresponding values of ‘y’ using a given equation and then plotting them on graphs of x axis and y axis.
Complete step-by-step answer:
To plot a graph we need coordinates $ (x,\,y) $ which we can easily get from equation $ y = {x^2} + 2 $ by subsuming any random values of x.
For example $ At\,\,x = 0 $ we will find the corresponding value of y
On substituting $ x = 0 $ in the given equation. We have
$ y = {(0)^2} + 2 $
$ \Rightarrow y = 2 $
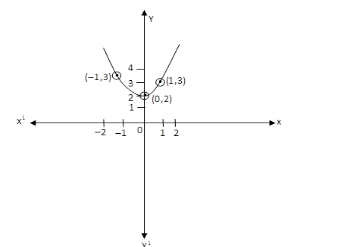
$ \therefore $ We get coordinates (0, 2)
Similarly, we will obtain two more coordinates to plot a graph we need at best three coordinates.
at $ x = 1 $ we have,
$ y = {(1)^2} + 2 = 1 + 2 = 3 $
$ \therefore \,\,at\,\,x = 1 $ We have $ y = 3 $
at $ x = - 1 $
$ y = {( - 1)^2} + 2 = 1 + 2 = 3 $
at $ x = \, - 1 $ , $ y = 3 $
Therefore, from above we have:
To draw a graph we first plot the above point in the xy plane and then joining these points we have a required curve.
On joining all points we see that the graph obtained is a parabola. And we see that the parabola does not touch
$ x - axis $
$ \therefore \,\,\,\,y = {x^2} + 2 $ has no roots.
Note: For plotting any type of graph one should not take big values as it is difficult to plot them on graph or for plotting big values require big graphs. Also, from small values graphs obtained will also be the same as graphs obtained from big values.
Complete step-by-step answer:
To plot a graph we need coordinates $ (x,\,y) $ which we can easily get from equation $ y = {x^2} + 2 $ by subsuming any random values of x.
For example $ At\,\,x = 0 $ we will find the corresponding value of y
On substituting $ x = 0 $ in the given equation. We have
$ y = {(0)^2} + 2 $
$ \Rightarrow y = 2 $
$ \therefore $ We get coordinates (0, 2)
Similarly, we will obtain two more coordinates to plot a graph we need at best three coordinates.
at $ x = 1 $ we have,
$ y = {(1)^2} + 2 = 1 + 2 = 3 $
$ \therefore \,\,at\,\,x = 1 $ We have $ y = 3 $
at $ x = - 1 $
$ y = {( - 1)^2} + 2 = 1 + 2 = 3 $
at $ x = \, - 1 $ , $ y = 3 $
Therefore, from above we have:
| x | 0 | 1 | -1 |
| y | 2 | 3 | 3 |
To draw a graph we first plot the above point in the xy plane and then joining these points we have a required curve.
On joining all points we see that the graph obtained is a parabola. And we see that the parabola does not touch
$ x - axis $
$ \therefore \,\,\,\,y = {x^2} + 2 $ has no roots.
Note: For plotting any type of graph one should not take big values as it is difficult to plot them on graph or for plotting big values require big graphs. Also, from small values graphs obtained will also be the same as graphs obtained from big values.

Recently Updated Pages
Master Class 9 General Knowledge: Engaging Questions & Answers for Success
Master Class 9 Maths: Engaging Questions & Answers for Success
Master Class 9 Science: Engaging Questions & Answers for Success
Master Class 9 English: Engaging Questions & Answers for Success
Master Class 9 Social Science: Engaging Questions & Answers for Success
Class 9 Question and Answer - Your Ultimate Solutions Guide
Trending doubts
Find the sum of series 1 + 2 + 3 + 4 + 5 + + 100 class 9 maths CBSE
Difference Between Plant Cell and Animal Cell
Fill the blanks with the suitable prepositions 1 The class 9 english CBSE
What is pollution? How many types of pollution? Define it
What is the Full Form of ICSE / ISC ?
Name 10 Living and Non living things class 9 biology CBSE