


Draw the distance-time graph for the following situations;
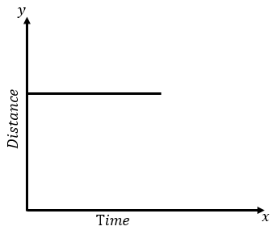
i. When the body is stationary.
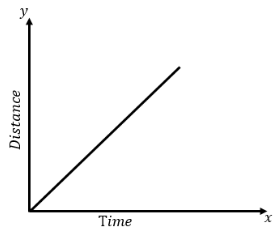
ii. When the body is moving with uniform speed.
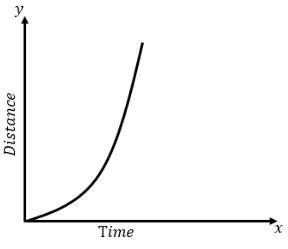
iii. When the body is moving with variable speed and uniform acceleration.
Answer
608.4k+ views
Hint: If the distance does not change with the time, the distance-time graph remains parallel to the time axis. if the graph leans towards the distance axis, then the graph indicates that there is greater displacement of the body with respect to the time. The slope of the distance-time graph is the velocity of the body and the slope of the velocity-time graph is the acceleration of the body.
Complete answer:
(i) When the body is stationary: When the body does not move with respect to time, the curve in the distance-time graph becomes parallel to the time axis. We can draw the distance-time graph for the stationary body as shown in the following figure.
(ii) When body is moving in uniform speed:
We know that the slope of the distance-time graph is the velocity of the body. That is, we can write, \[v = \dfrac{{\Delta x}}{{\Delta t}}\]
Since the speed of the body is uniform, the slope of the distance-time graph does not change that is constant. Therefore, the distance-time graph of the body moving with uniform speed is straight line passing through the centre as shown in the figure below,
(iii) When the body is moving in non- non-uniform speed and uniform acceleration:
As we know, \[a = \dfrac{{dv}}{{dt}} = \dfrac{{{d^2}x}}{{d{t^2}}}\]. Therefore, the distance-time graph will be the exponential rise with respect to time as shown in the figure below.
Note: If the distance time graph is straight line then the motion is uniform. The speed can be calculated using the slope of the graph. Sometimes the speed of objects may increase or decrease with time interest, the curve may go up and down with respect to time. The uses of distance- time graphs are: the nature of motion is given at a glance. The relative motion at various intervals can be predicted. The region of acceleration or retardation can be estimated without any calculation. The distance of the moving body at any time unit can be calculated.
Recently Updated Pages
Master Class 11 English: Engaging Questions & Answers for Success
Master Class 11 Social Science: Engaging Questions & Answers for Success
Master Class 11 Maths: Engaging Questions & Answers for Success
Master Class 11 Biology: Engaging Questions & Answers for Success
Master Class 11 Physics: Engaging Questions & Answers for Success
Master Class 11 Chemistry: Engaging Questions & Answers for Success
Trending doubts
One Metric ton is equal to kg A 10000 B 1000 C 100 class 11 physics CBSE
Difference Between Prokaryotic Cells and Eukaryotic Cells
Find the value of the expression given below sin 30circ class 11 maths CBSE
Difference between physical and chemical change class 11 chemistry CBSE
Two of the body parts which do not appear in MRI are class 11 biology CBSE
Draw a diagram of a plant cell and label at least eight class 11 biology CBSE