


Draw “less than give” and “more than give” for the following frequency distribution table and hence, find its median.
$\boxed{\begin{array}{*{20}{c}}
{Class}&{20 - 30}&{30 - 40}&{40 - 50}&{50 - 60}&{60 - 70}&{70 - 80}&{80 - 90} \\
{Frequency}&{10}&8&{12}&{24}&6&{25}&{15}
\end{array}}$
Answer
618.6k+ views
Hint: We will first make the frequency table for less than data and more than data and then using that, we will form a less than give graph and more than a give graph. Then to find the median we will just take half of the total frequency and mark that point image in the graphs.
Complete step-by-step answer:
We are given the data: $\boxed{\begin{array}{*{20}{c}}
{Class}&{20 - 30}&{30 - 40}&{40 - 50}&{50 - 60}&{60 - 70}&{70 - 80}&{80 - 90} \\
{Frequency}&{10}&8&{12}&{24}&6&{25}&{15}
\end{array}}$
Now, let us see it carefully, we see that less than 30 has a frequency of 10, then less than 40 will have both 20 – 30 and 30 – 40 as well. Similarly going on we will get the following table:-
Less than: Frequency:
Less than 30 = 10
Less than 40 = 10 + 08 = 18
Less than 50 = 18 + 12 = 30
Less than 60 = 30 + 24 = 54
Less than 70 = 54 + 06 = 60
Less than 80 = 60 + 25 = 85
Less than 90 = 85 + 15 = 100
The quantities on the left of the table show less than things and the right side is the cumulative frequency.
Now similarly in “more than” we will get:-
More than: Frequency:
More than 80 = 15
More than 70 = 15 + 25 = 40
More than 60 = 40 + 06 = 46
More than 50 = 46 + 24 = 70
More than 40 = 70 + 12 = 82
More than 30 = 82 + 08 = 90
More than 20 = 90 + 10 = 100
Now, let us plot these in a graph:-
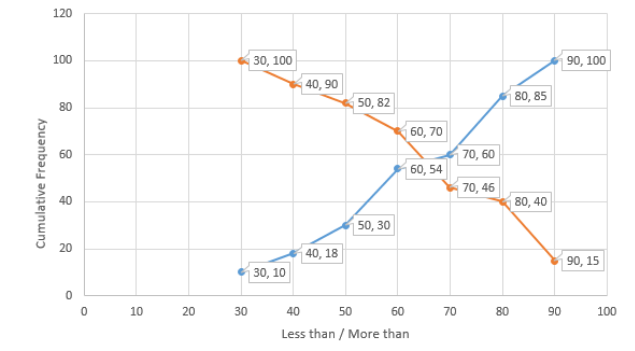
Now, the blue in above shows “less than” and the orange shows “more than”.
Now, for the median, we will have to find $\dfrac{N}{2}$, where N is the total frequency which is equal to 100 here.
So, $\dfrac{N}{2} = \dfrac{{100}}{2} = 50$.
Now, we will draw a straight line from 50, and wherever it will meet on y axis, that will be our median.
We can clearly see that 50 from x axis meets 30 from y axis in the blue graph values only.
Hence, the median of the data is 30.
Note: The students might make the mistake of not making separate tables for “less than data” and “more than data” and just try to plot the graph with the table already given to us but, that may lead to mistakes in values and wrong graphs eventually. The students also may plot both more than less than data in different graphs, but plotting them together just helps us to see a lot of data together in one graph only.
Median basically refers to the "middle" of a sorted list of numbers.
Complete step-by-step answer:
We are given the data: $\boxed{\begin{array}{*{20}{c}}
{Class}&{20 - 30}&{30 - 40}&{40 - 50}&{50 - 60}&{60 - 70}&{70 - 80}&{80 - 90} \\
{Frequency}&{10}&8&{12}&{24}&6&{25}&{15}
\end{array}}$
Now, let us see it carefully, we see that less than 30 has a frequency of 10, then less than 40 will have both 20 – 30 and 30 – 40 as well. Similarly going on we will get the following table:-
Less than: Frequency:
Less than 30 = 10
Less than 40 = 10 + 08 = 18
Less than 50 = 18 + 12 = 30
Less than 60 = 30 + 24 = 54
Less than 70 = 54 + 06 = 60
Less than 80 = 60 + 25 = 85
Less than 90 = 85 + 15 = 100
The quantities on the left of the table show less than things and the right side is the cumulative frequency.
Now similarly in “more than” we will get:-
More than: Frequency:
More than 80 = 15
More than 70 = 15 + 25 = 40
More than 60 = 40 + 06 = 46
More than 50 = 46 + 24 = 70
More than 40 = 70 + 12 = 82
More than 30 = 82 + 08 = 90
More than 20 = 90 + 10 = 100
Now, let us plot these in a graph:-
Now, the blue in above shows “less than” and the orange shows “more than”.
Now, for the median, we will have to find $\dfrac{N}{2}$, where N is the total frequency which is equal to 100 here.
So, $\dfrac{N}{2} = \dfrac{{100}}{2} = 50$.
Now, we will draw a straight line from 50, and wherever it will meet on y axis, that will be our median.
We can clearly see that 50 from x axis meets 30 from y axis in the blue graph values only.
Hence, the median of the data is 30.
Note: The students might make the mistake of not making separate tables for “less than data” and “more than data” and just try to plot the graph with the table already given to us but, that may lead to mistakes in values and wrong graphs eventually. The students also may plot both more than less than data in different graphs, but plotting them together just helps us to see a lot of data together in one graph only.
Median basically refers to the "middle" of a sorted list of numbers.
Recently Updated Pages
Master Class 12 Economics: Engaging Questions & Answers for Success
Master Class 12 English: Engaging Questions & Answers for Success
Master Class 12 Social Science: Engaging Questions & Answers for Success
Master Class 12 Maths: Engaging Questions & Answers for Success
Master Class 12 Physics: Engaging Questions & Answers for Success
Master Class 10 English: Engaging Questions & Answers for Success
Trending doubts
Explain the Treaty of Vienna of 1815 class 10 social science CBSE
Why is it 530 pm in india when it is 1200 afternoon class 10 social science CBSE
What is the full form of POSCO class 10 social science CBSE
Define Potential, Developed, Stock and Reserved resources
The speaker of the Lok Sabha is elected by the APresident class 10 social science CBSE
Complete the sentence with the most appropriate word class 10 english CBSE