


Draw graph which is used to calculate the activation energy of a reaction. Write the appropriate equation used to calculate the activation energy graphically.
Answer
521.7k+ views
Hint: Activation energy is the minimum amount of energy which is required during the reaction to form the product. We can find the amount of the activation energy with the help of the Arrhenius Equation. By taking logarithms of the equation we can plot the graph between the energy and the progress of the reaction.
Complete Step By Step Answer:
When a reaction proceeds to form a product, a certain amount of energy is required to cause the reaction. The certain energy which is required to cause the product formation is known as activation energy. The activation energy is also known as threshold energy. The concept of activation can be understood with e help of Arrhenius equation which is given as:
$ \Rightarrow k{\text{ }} = {\text{ }}A{e^{\dfrac{{ - {E_a}}}{{RT}}}} $
Where, k is rate constant of the reaction, A is pre-exponential factor, $ {E_a} $ is the activation energy of the reaction, T is the temperature and R is the universal gas constant.
By taking log of above equation, we can reduce it as,
$ \Rightarrow \ln k{\text{ }} = {\text{ ln}}\left( {A{e^{\dfrac{{ - {E_a}}}{{RT}}}}} \right) $ (Here log is natural log which is $ \ln $ )
$ \Rightarrow \ln k{\text{ }} = {\text{ lnA + ln}}\left( {{e^{\dfrac{{ - {E_a}}}{{RT}}}}} \right) $
$ \Rightarrow \ln k{\text{ }} = {\text{ ln}}\left( {\text{A}} \right){\text{ + }}\dfrac{{ - {E_a}}}{{RT}}{\text{ln}}\left( e \right) $
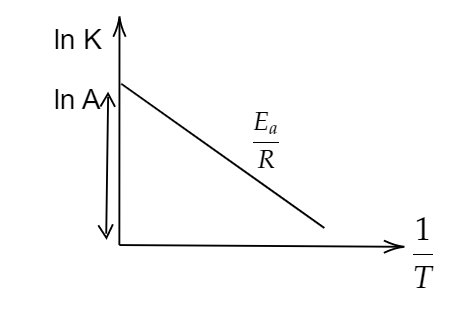
$ \Rightarrow \ln k{\text{ }} = {\text{ }}\dfrac{{ - {E_a}}}{R}\left( {\dfrac{1}{T}} \right){\text{ }} + {\text{ ln}}\left( {\text{A}} \right) $
On comparing above equation with :
$ y{\text{ }} = {\text{ }}mx{\text{ }} + {\text{ }}c $
We can depict that, $ m{\text{ }} = {\text{ }}\dfrac{{ - {E_a}}}{R} $ , with X- axis as $ \dfrac{1}{T} $ along Y-axis as $ \ln k $ and constant of $ {\text{ln}}\left( A \right) $ . Therefore we can plot the graph as:
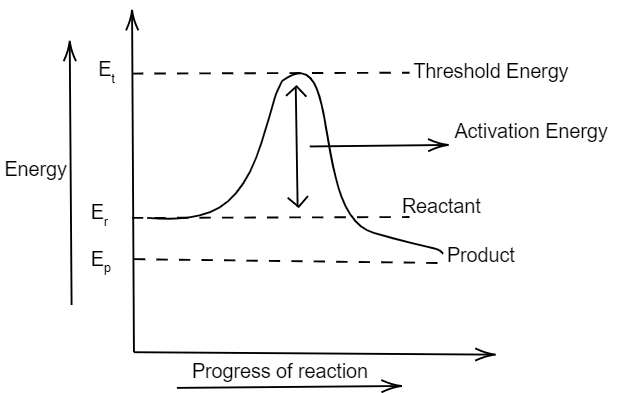
Also the graph between the energy of reaction and progress of reaction can be plotted as:
Note:
We have plotted the graph between $ \dfrac{1}{T} $ and $ \ln k $ so as to make the graph simple and easy. We can also plot a graph between the T and K also. The activation energy works like a threshold energy. Activation energy of different reactions depend on the nature of reactant and the overall energy of reaction. Also it may vary for exothermic and endothermic reactions.
Complete Step By Step Answer:
When a reaction proceeds to form a product, a certain amount of energy is required to cause the reaction. The certain energy which is required to cause the product formation is known as activation energy. The activation energy is also known as threshold energy. The concept of activation can be understood with e help of Arrhenius equation which is given as:
$ \Rightarrow k{\text{ }} = {\text{ }}A{e^{\dfrac{{ - {E_a}}}{{RT}}}} $
Where, k is rate constant of the reaction, A is pre-exponential factor, $ {E_a} $ is the activation energy of the reaction, T is the temperature and R is the universal gas constant.
By taking log of above equation, we can reduce it as,
$ \Rightarrow \ln k{\text{ }} = {\text{ ln}}\left( {A{e^{\dfrac{{ - {E_a}}}{{RT}}}}} \right) $ (Here log is natural log which is $ \ln $ )
$ \Rightarrow \ln k{\text{ }} = {\text{ lnA + ln}}\left( {{e^{\dfrac{{ - {E_a}}}{{RT}}}}} \right) $
$ \Rightarrow \ln k{\text{ }} = {\text{ ln}}\left( {\text{A}} \right){\text{ + }}\dfrac{{ - {E_a}}}{{RT}}{\text{ln}}\left( e \right) $
$ \Rightarrow \ln k{\text{ }} = {\text{ }}\dfrac{{ - {E_a}}}{R}\left( {\dfrac{1}{T}} \right){\text{ }} + {\text{ ln}}\left( {\text{A}} \right) $
On comparing above equation with :
$ y{\text{ }} = {\text{ }}mx{\text{ }} + {\text{ }}c $
We can depict that, $ m{\text{ }} = {\text{ }}\dfrac{{ - {E_a}}}{R} $ , with X- axis as $ \dfrac{1}{T} $ along Y-axis as $ \ln k $ and constant of $ {\text{ln}}\left( A \right) $ . Therefore we can plot the graph as:
Also the graph between the energy of reaction and progress of reaction can be plotted as:
Note:
We have plotted the graph between $ \dfrac{1}{T} $ and $ \ln k $ so as to make the graph simple and easy. We can also plot a graph between the T and K also. The activation energy works like a threshold energy. Activation energy of different reactions depend on the nature of reactant and the overall energy of reaction. Also it may vary for exothermic and endothermic reactions.
Recently Updated Pages
Master Class 11 English: Engaging Questions & Answers for Success
Master Class 11 Social Science: Engaging Questions & Answers for Success
Master Class 11 Maths: Engaging Questions & Answers for Success
Master Class 11 Biology: Engaging Questions & Answers for Success
Master Class 11 Physics: Engaging Questions & Answers for Success
Master Class 11 Chemistry: Engaging Questions & Answers for Success
Trending doubts
One Metric ton is equal to kg A 10000 B 1000 C 100 class 11 physics CBSE
Difference Between Prokaryotic Cells and Eukaryotic Cells
Find the value of the expression given below sin 30circ class 11 maths CBSE
Difference between physical and chemical change class 11 chemistry CBSE
Two of the body parts which do not appear in MRI are class 11 biology CBSE
Draw a diagram of a plant cell and label at least eight class 11 biology CBSE