


Draw double bar graph for the following data
Score on the practical test and test
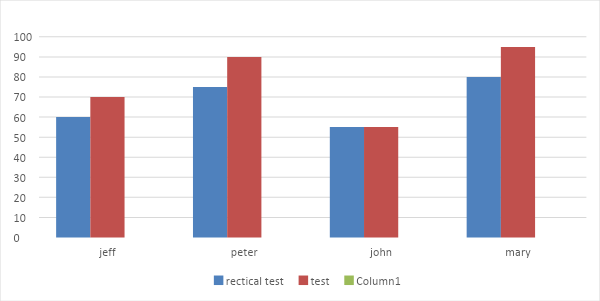
Student Practice test test Jeff 60 70 Peter 75 90 John 55 55 Mary 80 95
| Student | Practice test | test |
| Jeff | 60 | 70 |
| Peter | 75 | 90 |
| John | 55 | 55 |
| Mary | 80 | 95 |
Answer
578.4k+ views
Hint: There will be two axis in which horizontal axis will be of marks of student of vertical axis will name of axis 1st mark marks of jeff on the graph and plot and draw a rectangular bar then mark peter marks after that john and then Mary. Color practice test bar as blue and test bar as red.
Complete step-by-step answer:
Jeff marks in practical test 60 and in test he got 70 so mark the no. on the graph, draw a horizontal bar with different color blue for practical and red for test. Leave some distance for the next student so it will look clean.
Similarly with Peter, John and Mary mark their marks and draw a horizontal bar in which blue for practical and red for test.
Note: Horizontal double bar – a graph showing pairs of bars that represent two types of related data. Type of data must be differentiated to reduce the confusion and make graphs easy to understand. Horizontal axis will be the value of data and vertical name of the data.
Recently Updated Pages
Master Class 9 General Knowledge: Engaging Questions & Answers for Success
Master Class 9 Social Science: Engaging Questions & Answers for Success
Master Class 9 English: Engaging Questions & Answers for Success
Master Class 9 Maths: Engaging Questions & Answers for Success
Master Class 9 Science: Engaging Questions & Answers for Success
Class 9 Question and Answer - Your Ultimate Solutions Guide
Trending doubts
Difference Between Plant Cell and Animal Cell
Fill the blanks with the suitable prepositions 1 The class 9 english CBSE
Who is eligible for RTE class 9 social science CBSE
Which places in India experience sunrise first and class 9 social science CBSE
What is pollution? How many types of pollution? Define it
Name 10 Living and Non living things class 9 biology CBSE