




Draw a venn diagram to represent $A-\left( A\cap B \right)$ .
Answer
 Verified
648.6k+ views
Hint: The venn diagrams are the pictorial representation of the relationships between sets. It is also easier to interpret the region than understanding the equation. To solve this question, we need to solve the bracket operation first. The bracket expression shows the intersection of the two events. Further, the intersection region is to be subtracted from A.
Complete step-by-step answer:
To draw $A-\left( A\cap B \right)$, we need to understand the meaning of the symbols.
The symbol $\cap $ represents the intersection of the two sets.
When $\cap $ is used we need to consider the region which is common in both regions,
The negative sign “ - “show the regular subtraction of a region from another.
Let's consider the circular region A and B for simplicity.
It is shown as bellows,
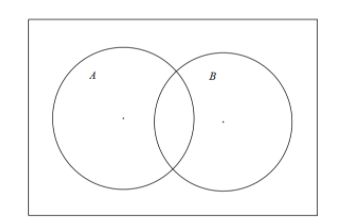
According to the equation we need $A\cap B$ first,
As we can see the middle region which is common in both circles is $A\cap B$ .
We will show the selected region in the shading.
Therefore, the venn diagram looks like as follows,
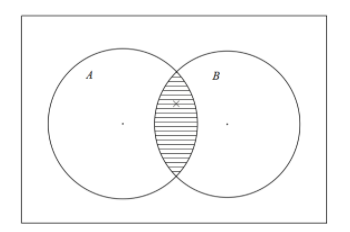
Now, we need to subtract $A\cap B$ from $A$ .
The region covers the whole circle of A. Therefore, by subtracting the shaded region from A we will get the newly shaded region of $A-\left( A\cap B \right)$ .
It is shown below,
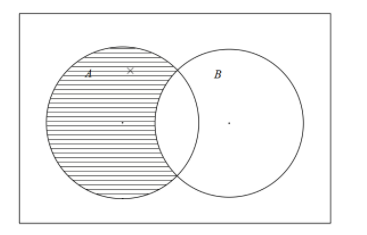
Therefore, the shaded region is the required region.
Note: The important point to take care is to follow the bracket while performing the operation. The order of operation is very important. The terms in brackets are always given higher priority. Also, an important point to be remembered is that it is easily confused with the $\cap $ and $\cup $ . The $\cap $ shows the common intersection between two regions while $\cup $ shows the region which is either in the two regions.
Complete step-by-step answer:
To draw $A-\left( A\cap B \right)$, we need to understand the meaning of the symbols.
The symbol $\cap $ represents the intersection of the two sets.
When $\cap $ is used we need to consider the region which is common in both regions,
The negative sign “ - “show the regular subtraction of a region from another.
Let's consider the circular region A and B for simplicity.
It is shown as bellows,
According to the equation we need $A\cap B$ first,
As we can see the middle region which is common in both circles is $A\cap B$ .
We will show the selected region in the shading.
Therefore, the venn diagram looks like as follows,
Now, we need to subtract $A\cap B$ from $A$ .
The region covers the whole circle of A. Therefore, by subtracting the shaded region from A we will get the newly shaded region of $A-\left( A\cap B \right)$ .
It is shown below,
Therefore, the shaded region is the required region.
Note: The important point to take care is to follow the bracket while performing the operation. The order of operation is very important. The terms in brackets are always given higher priority. Also, an important point to be remembered is that it is easily confused with the $\cap $ and $\cup $ . The $\cap $ shows the common intersection between two regions while $\cup $ shows the region which is either in the two regions.
Recently Updated Pages
Master Class 11 English: Engaging Questions & Answers for Success

Master Class 11 Physics: Engaging Questions & Answers for Success
Master Class 11 Computer Science: Engaging Questions & Answers for Success
Master Class 11 Chemistry: Engaging Questions & Answers for Success
Master Class 11 Social Science: Engaging Questions & Answers for Success
Master Class 11 Accountancy: Engaging Questions & Answers for Success
Trending doubts
Difference Between Prokaryotic Cells and Eukaryotic Cells
Two of the body parts which do not appear in MRI are class 11 biology CBSE
One Metric ton is equal to kg A 10000 B 1000 C 100 class 11 physics CBSE
10 examples of friction in our daily life
Draw a diagram of nephron and explain its structur class 11 biology CBSE
Draw a diagram of a plant cell and label at least eight class 11 biology CBSE