


Draw a subdivided bar graph to illustrate the given data:
Years Wheat Barley Oats 1991 34 18 27 1992 43 14 24 1993 43 16 27 1994 45 13 34
| Years | Wheat | Barley | Oats |
| 1991 | 34 | 18 | 27 |
| 1992 | 43 | 14 | 24 |
| 1993 | 43 | 16 | 27 |
| 1994 | 45 | 13 | 34 |
Answer
572.7k+ views
Hint: First of all, we will draw the required axis, on which on the x – axis side, we will keep the years and on the y – axis side, we will draw the numbers as required quantities.
Complete step by step solution:
Let us first of all look at the given table:-
We can see that we have the data of 4 years that are 1991, 1992, 1993 and 1994 with us which we are required to represent in the bar graph form.
So, we will take the normal co – ordinate axis, on which we will keep the years towards the x – axis side and the quantities on the y – axis side. Let us represent this in some figure as given below:-
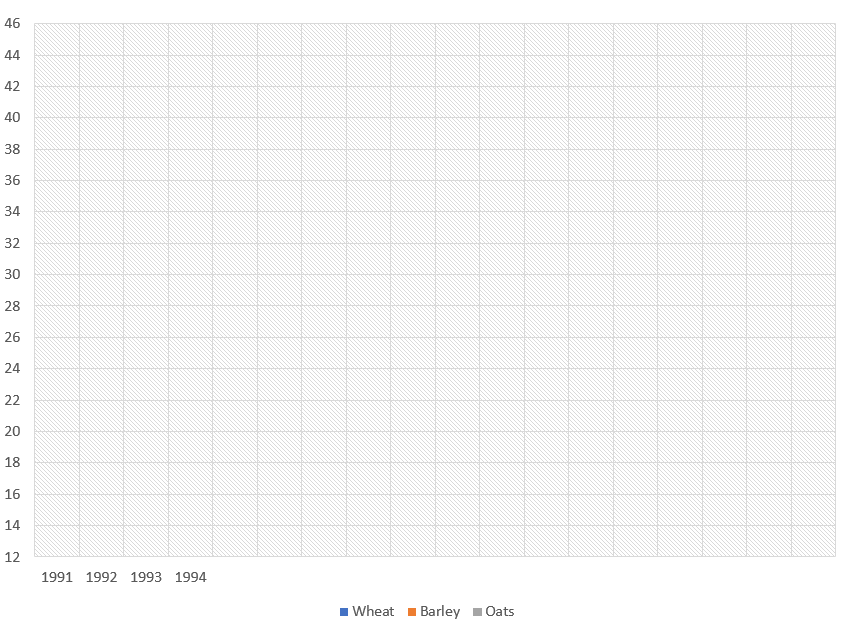
Now, we have assigned the years and the quantities.
Also, if you notice the small coloured boxes in the graph denote the colour how that data will be represented by.
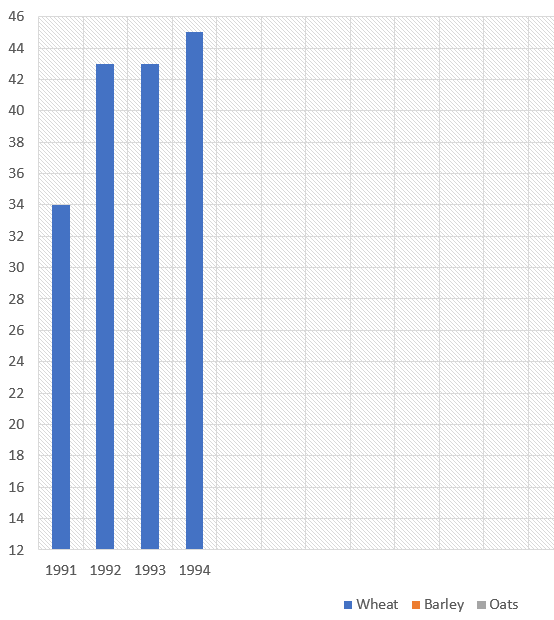
Now, we will put in the values of Wheat to make it much clear and then add on others one by one as well.
Let us add the wheat quantities in the above given graph. We will then obtain:-
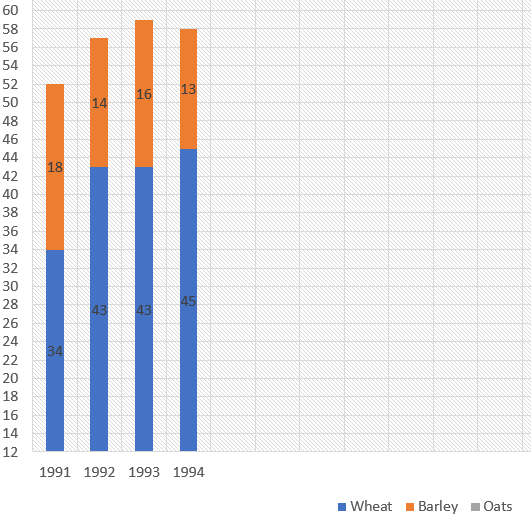
Now, similarly like this, we will add in the values of barley on the top of wheat.
Then, we will obtain the following graph:-
Now, similarly like this, we will add in the values of oats on the top of barley.
Then, we will obtain the following graph:-
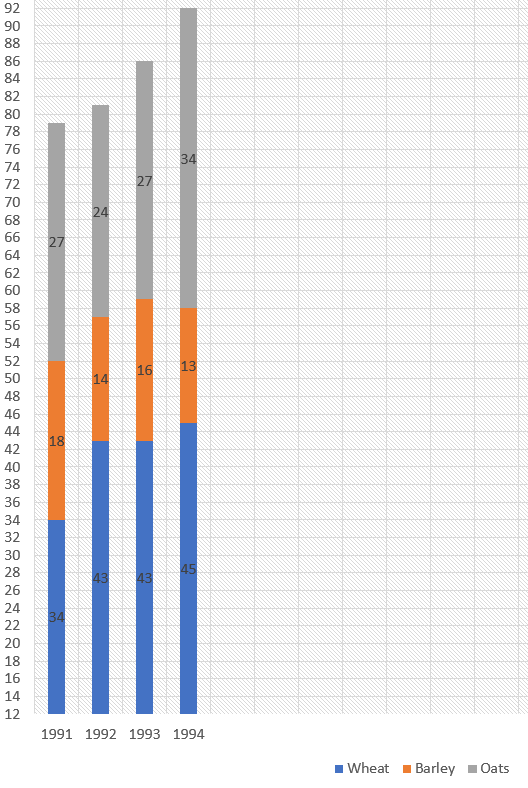
Thus, we have the required graph.
Note: The students must note that they might make the mistake of not writing the values inside like we did in the graph but writing the values gives us a better and clear picture to then evaluate the data.
The students must also know that the bar graph is an easy way to represent and look at the data without giving much of an effort.
Complete step by step solution:
Let us first of all look at the given table:-
| Years | Wheat | Barley | Oats |
| 1991 | 34 | 18 | 27 |
| 1992 | 43 | 14 | 24 |
| 1993 | 43 | 16 | 27 |
| 1994 | 45 | 13 | 34 |
We can see that we have the data of 4 years that are 1991, 1992, 1993 and 1994 with us which we are required to represent in the bar graph form.
So, we will take the normal co – ordinate axis, on which we will keep the years towards the x – axis side and the quantities on the y – axis side. Let us represent this in some figure as given below:-
Now, we have assigned the years and the quantities.
Also, if you notice the small coloured boxes in the graph denote the colour how that data will be represented by.
Now, we will put in the values of Wheat to make it much clear and then add on others one by one as well.
Let us add the wheat quantities in the above given graph. We will then obtain:-
Now, similarly like this, we will add in the values of barley on the top of wheat.
Then, we will obtain the following graph:-
Now, similarly like this, we will add in the values of oats on the top of barley.
Then, we will obtain the following graph:-
Thus, we have the required graph.
Note: The students must note that they might make the mistake of not writing the values inside like we did in the graph but writing the values gives us a better and clear picture to then evaluate the data.
The students must also know that the bar graph is an easy way to represent and look at the data without giving much of an effort.
Recently Updated Pages
Master Class 10 English: Engaging Questions & Answers for Success
Master Class 10 Social Science: Engaging Questions & Answers for Success
Master Class 10 Computer Science: Engaging Questions & Answers for Success
Class 10 Question and Answer - Your Ultimate Solutions Guide
Master Class 10 General Knowledge: Engaging Questions & Answers for Success
Master Class 10 Maths: Engaging Questions & Answers for Success
Trending doubts
What is the full form of NDA a National Democratic class 10 social science CBSE
Explain the Treaty of Vienna of 1815 class 10 social science CBSE
Who Won 36 Oscar Awards? Record Holder Revealed
Bharatiya Janata Party was founded in the year A 1979 class 10 social science CBSE
What is the median of the first 10 natural numbers class 10 maths CBSE
Why is it 530 pm in india when it is 1200 afternoon class 10 social science CBSE