


How can I draw a reaction coordinate in a potential energy diagram?
Answer
578.1k+ views
Hint:Potential energy diagram is a curve which represents the situation of curve in two types of reaction. These reactions are classified in terms of energy released or energy gain. So, the curve represents the positions of both reactants and products. Now it can be modified when a catalyst is used for a certain type of process.
Complete step-by-step answer:For drawing the curve, we take potential energy at the y-axis and on the x-axis we take the reaction coordinate. The graph starts at the potential energy side and forms a curve and can end at the lower potential energy and higher potential energy. Let’s take an example, when a reaction energy is released in the form of heat that means we are talking about an exothermic reaction. In an exothermic reaction the potential energy of a product is lesser than the potential energy of the reactant . This can be understood in the fact that as energy is already released in the reaction the products which are formed have lesser energy. In case of a catalyst which does participate in the reaction but remains unchanged, in that case the activation energy becomes lower; it means that many reactant molecules can change more easily than before to become products. . The graph given below is of exothermic reaction; it means reaction when energy is released in the process.
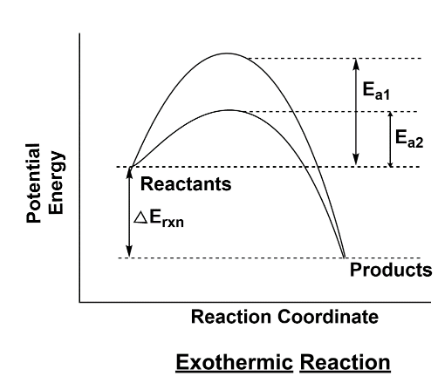
\[{E_{a1}}\] is activation energy in the absence of catalyst
\[{E_{a2}}\] is activation energy in the presence of catalyst
\[{E_{a1}}\] is activation energy in the absence of catalyst
\[{E_{a2}}\] is activation energy in the presence of catalyst
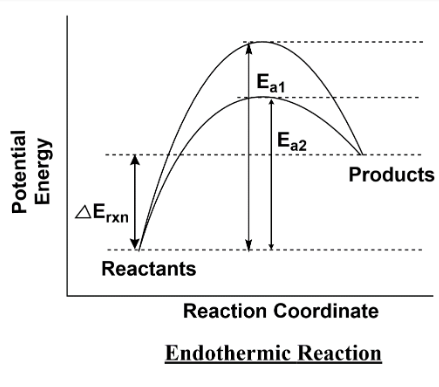
The second graph is of the endothermic reaction process which requires heat for happening. As shown in the figure one side you have a potential curve for exothermic reaction and the other side the curve is for endothermic reaction. In the curve, the red line shows the activation energy without catalyst while the green line shows the activation energy with catalyst. So we can understand it as the reaction gets faster when we use a catalyst, it provides an alternative path for reactants to change into products.
Note:As we understand the graph for the exothermic process similarly we have an endothermic reaction, in which we have to provide heat from the surrounding to the system. In thermodynamics we use the term system and surroundings, further the system is again classified on the basis of walls it has. So remember that drawing the curve is similar for all types of system, the only difference is in the exchange of matter or energy.
Complete step-by-step answer:For drawing the curve, we take potential energy at the y-axis and on the x-axis we take the reaction coordinate. The graph starts at the potential energy side and forms a curve and can end at the lower potential energy and higher potential energy. Let’s take an example, when a reaction energy is released in the form of heat that means we are talking about an exothermic reaction. In an exothermic reaction the potential energy of a product is lesser than the potential energy of the reactant . This can be understood in the fact that as energy is already released in the reaction the products which are formed have lesser energy. In case of a catalyst which does participate in the reaction but remains unchanged, in that case the activation energy becomes lower; it means that many reactant molecules can change more easily than before to become products. . The graph given below is of exothermic reaction; it means reaction when energy is released in the process.
\[{E_{a1}}\] is activation energy in the absence of catalyst
\[{E_{a2}}\] is activation energy in the presence of catalyst
\[{E_{a1}}\] is activation energy in the absence of catalyst
\[{E_{a2}}\] is activation energy in the presence of catalyst
The second graph is of the endothermic reaction process which requires heat for happening. As shown in the figure one side you have a potential curve for exothermic reaction and the other side the curve is for endothermic reaction. In the curve, the red line shows the activation energy without catalyst while the green line shows the activation energy with catalyst. So we can understand it as the reaction gets faster when we use a catalyst, it provides an alternative path for reactants to change into products.
Note:As we understand the graph for the exothermic process similarly we have an endothermic reaction, in which we have to provide heat from the surrounding to the system. In thermodynamics we use the term system and surroundings, further the system is again classified on the basis of walls it has. So remember that drawing the curve is similar for all types of system, the only difference is in the exchange of matter or energy.
Recently Updated Pages
Master Class 11 Social Science: Engaging Questions & Answers for Success
Master Class 11 English: Engaging Questions & Answers for Success
Master Class 11 Maths: Engaging Questions & Answers for Success
Master Class 11 Chemistry: Engaging Questions & Answers for Success
Master Class 11 Biology: Engaging Questions & Answers for Success
Master Class 11 Physics: Engaging Questions & Answers for Success
Trending doubts
One Metric ton is equal to kg A 10000 B 1000 C 100 class 11 physics CBSE
Difference Between Prokaryotic Cells and Eukaryotic Cells
Draw a diagram of a plant cell and label at least eight class 11 biology CBSE
Two of the body parts which do not appear in MRI are class 11 biology CBSE
Which gas is abundant in air class 11 chemistry CBSE
10 examples of friction in our daily life