


Draw a pie chart for the following data.
Team of expenditure Amount spent Food $3750$ Health $1875$ Clothing $1875$ Education $1200$ Saving $7500$
| Team of expenditure | Amount spent |
| Food | $3750$ |
| Health | $1875$ |
| Clothing | $1875$ |
| Education | $1200$ |
| Saving | $7500$ |
Answer
568.8k+ views
Hint: According to the question given in the question we have to determine the pie chart for the amount spent in food, health, clothing, education, and saving which are $3750,1875,1875,1200$ and $7500$. So, first of all we have to understand about the pie chart which is as explained below:
Pie chart: A pie chart is circular in shape and is a circular statistical graphic, which is divided into slices to illustrate numerical portions and in a pie chart the arc length of each slice which is its consequently its central angle and area is proportional to the quantity represented. While it is named for its resemblance to a pie which has been sliced, there are various ways it can be presented.
Now, we have to draw the pie chart as explained above, for the given data table.
To obtain the pie chart first of all we have to determine the total amount spent which can be just adding all of the given amounts.
Now, we have to determine the central angle for the pie chart which can be determined by dividing the given amounts by the sum of total amount and then we have to multiply it with the angle ${360^0}$
Complete step-by-step solution:
Step 1: First of all we have to determine the sum of all the amounts which are $3750,1875,1875,1200$ and $7500$ which are spent in food, health, clothing, education, and saving. Hence,
$
= 3750 + 1875 + 1875 + 1200 + 7500 \\
= 16200
$
Step 2: Now, we have to determine the fraction in which we just have to divide the given cost for different causes with the sum of total amounts as obtained in the solution step 1. Hence,
Step 3: Now, we have to determine the central angle and for this we just have to multiply the obtained fraction with the angle ${360^0}$as mentioned in the solution hint.
Step 4: Now, as we have obtained the central angle so we just have to draw the pie chart for the data obtained just above which is as given below:
Note: To determine the central angle first of all we have to determine the fraction of the amount spent in different causes by the sum of total amount and after that we have to multiply the obtained faction with the fractions obtained.
A circular statistical graphic, which is divided into slices to illustrate numerical portions and in a pie chart the arc length of each slice which is its consequently its central angle and area is proportional to the quantity represented is a pie chart.
Pie chart: A pie chart is circular in shape and is a circular statistical graphic, which is divided into slices to illustrate numerical portions and in a pie chart the arc length of each slice which is its consequently its central angle and area is proportional to the quantity represented. While it is named for its resemblance to a pie which has been sliced, there are various ways it can be presented.
Now, we have to draw the pie chart as explained above, for the given data table.
To obtain the pie chart first of all we have to determine the total amount spent which can be just adding all of the given amounts.
Now, we have to determine the central angle for the pie chart which can be determined by dividing the given amounts by the sum of total amount and then we have to multiply it with the angle ${360^0}$
Complete step-by-step solution:
Step 1: First of all we have to determine the sum of all the amounts which are $3750,1875,1875,1200$ and $7500$ which are spent in food, health, clothing, education, and saving. Hence,
$
= 3750 + 1875 + 1875 + 1200 + 7500 \\
= 16200
$
Step 2: Now, we have to determine the fraction in which we just have to divide the given cost for different causes with the sum of total amounts as obtained in the solution step 1. Hence,
| Team of expenditure | Amount spent | Fraction |
| Food | $3750$ | $\dfrac{{3750}}{{16200}} = \dfrac{{25}}{{208}}$ |
| Health | $1875$ | $\dfrac{{1875}}{{16200}} = \dfrac{{25}}{{216}}$ |
| Clothing | $1875$ | $\dfrac{{1875}}{{16200}} = \dfrac{{25}}{{216}}$ |
| Education | $1200$ | $\dfrac{{1200}}{{16200}} = \dfrac{2}{{27}}$ |
| Saving | $7500$ | $\dfrac{{7500}}{{16200}} = \dfrac{{25}}{{54}}$ |
Step 3: Now, we have to determine the central angle and for this we just have to multiply the obtained fraction with the angle ${360^0}$as mentioned in the solution hint.
| Team of expenditure | Amount spent | Fraction | Central angle |
| Food | $3750$ | $\dfrac{{3750}}{{16200}} = \dfrac{{25}}{{208}}$ | $\dfrac{{25}}{{208}} \times {360^0} = {83.3^0}$ |
| Health | $1875$ | $\dfrac{{1875}}{{16200}} = \dfrac{{25}}{{216}}$ | $\dfrac{{25}}{{216}} \times {360^0} = {41.7^0}$ |
| Clothing | $1875$ | $\dfrac{{1875}}{{16200}} = \dfrac{{25}}{{216}}$ | $\dfrac{{25}}{{216}} \times {360^0} = {41.7^0}$ |
| Education | $1200$ | $\dfrac{{1200}}{{16200}} = \dfrac{2}{{27}}$ | $\dfrac{2}{{27}} \times {360^0} = {26.7^0}$ |
| Saving | $7500$ | $\dfrac{{7500}}{{16200}} = \dfrac{{25}}{{54}}$ | $\dfrac{{25}}{{54}} \times {360^0} = {166.6^0}$ |
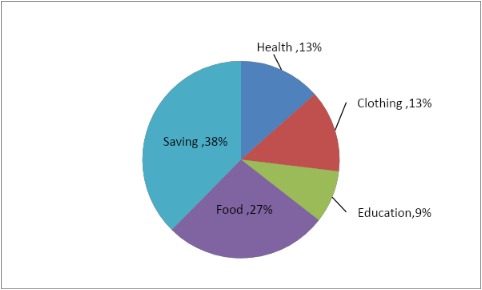
Step 4: Now, as we have obtained the central angle so we just have to draw the pie chart for the data obtained just above which is as given below:
Note: To determine the central angle first of all we have to determine the fraction of the amount spent in different causes by the sum of total amount and after that we have to multiply the obtained faction with the fractions obtained.
A circular statistical graphic, which is divided into slices to illustrate numerical portions and in a pie chart the arc length of each slice which is its consequently its central angle and area is proportional to the quantity represented is a pie chart.
Recently Updated Pages
Master Class 11 Computer Science: Engaging Questions & Answers for Success
Master Class 11 Business Studies: Engaging Questions & Answers for Success
Master Class 11 Economics: Engaging Questions & Answers for Success
Master Class 11 English: Engaging Questions & Answers for Success
Master Class 11 Maths: Engaging Questions & Answers for Success
Master Class 11 Biology: Engaging Questions & Answers for Success
Trending doubts
One Metric ton is equal to kg A 10000 B 1000 C 100 class 11 physics CBSE
There are 720 permutations of the digits 1 2 3 4 5 class 11 maths CBSE
Discuss the various forms of bacteria class 11 biology CBSE
Draw a diagram of a plant cell and label at least eight class 11 biology CBSE
State the laws of reflection of light
Explain zero factorial class 11 maths CBSE