


Draw a percentage Bar graph for the following data
Divisions A B C D Total strength 65 56 54 50 Students passed in English 36 42 27 23
| Divisions | A | B | C | D |
| Total strength | 65 | 56 | 54 | 50 |
| Students passed in English | 36 | 42 | 27 | 23 |
Answer
565.8k+ views
Hint: To determine the bar graph of the data given below, initially we should find the Percentage of students passed in English subject from the given data. That is total strength of Divisions A, B, C and D and the Students passed in English in each division respectively. Using the Percentage of students passed in English we have to plot the bar graph of division verses Percentage of students passed in English.
Complete step-by-step answer:
Firstly Percentage of the students passed in English should be calculated using the formula,
Percentage of students passed in English = \[\dfrac{Students\text{ }passed\text{ }in\text{ }English}{Total\text{ }strength}\times 100\]
Now, let us tabulate the given data as with a column for Percentage of students passed in English as below,
The required bar chart will be as below,
Note: It is necessary for students to know the formula to find the Percentage of students passed in English from the given data to proceed with the problem. Then plotting the data in the bar graph helps us for pictorial representation of the content. Students sometimes can go wrong while tabulation of the data.
Complete step-by-step answer:
Firstly Percentage of the students passed in English should be calculated using the formula,
Percentage of students passed in English = \[\dfrac{Students\text{ }passed\text{ }in\text{ }English}{Total\text{ }strength}\times 100\]
Now, let us tabulate the given data as with a column for Percentage of students passed in English as below,
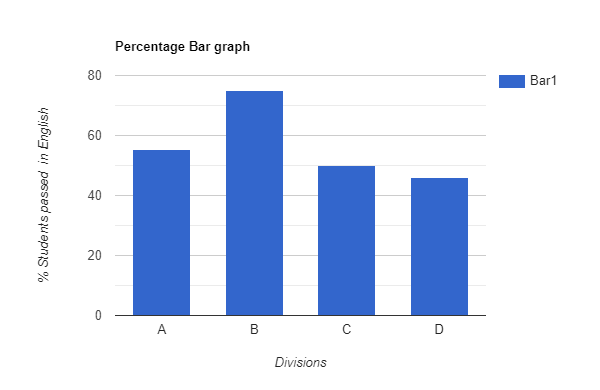
| Divisions | Total strength | Students passed in English | % Students passed in English |
| A | 65 | 36 | 55.4% |
| B | 56 | 42 | 75% |
| C | 54 | 27 | 50% |
| D | 50 | 23 | 46% |
The required bar chart will be as below,
Note: It is necessary for students to know the formula to find the Percentage of students passed in English from the given data to proceed with the problem. Then plotting the data in the bar graph helps us for pictorial representation of the content. Students sometimes can go wrong while tabulation of the data.
Recently Updated Pages
Three beakers labelled as A B and C each containing 25 mL of water were taken A small amount of NaOH anhydrous CuSO4 and NaCl were added to the beakers A B and C respectively It was observed that there was an increase in the temperature of the solutions contained in beakers A and B whereas in case of beaker C the temperature of the solution falls Which one of the following statements isarecorrect i In beakers A and B exothermic process has occurred ii In beakers A and B endothermic process has occurred iii In beaker C exothermic process has occurred iv In beaker C endothermic process has occurred
Master Class 10 Social Science: Engaging Questions & Answers for Success
Master Class 10 Science: Engaging Questions & Answers for Success
Master Class 10 Maths: Engaging Questions & Answers for Success
Master Class 10 General Knowledge: Engaging Questions & Answers for Success
Master Class 10 Computer Science: Engaging Questions & Answers for Success
Three beakers labelled as A B and C each containing 25 mL of water were taken A small amount of NaOH anhydrous CuSO4 and NaCl were added to the beakers A B and C respectively It was observed that there was an increase in the temperature of the solutions contained in beakers A and B whereas in case of beaker C the temperature of the solution falls Which one of the following statements isarecorrect i In beakers A and B exothermic process has occurred ii In beakers A and B endothermic process has occurred iii In beaker C exothermic process has occurred iv In beaker C endothermic process has occurred
Master Class 10 Social Science: Engaging Questions & Answers for Success
Master Class 10 Science: Engaging Questions & Answers for Success
Trending doubts
Explain the Treaty of Vienna of 1815 class 10 social science CBSE
In cricket, what is the term for a bowler taking five wickets in an innings?
Who Won 36 Oscar Awards? Record Holder Revealed
What is the median of the first 10 natural numbers class 10 maths CBSE
Why is it 530 pm in india when it is 1200 afternoon class 10 social science CBSE
What is deficiency disease class 10 biology CBSE