


Draw a percentage bar diagram showing literate and illiterate women in a village.
Village Haveli Bangli Kakdi Sitapur Literate Women 240 180 510 1150 Illiterate Women 320 720 170 130
| Village | Haveli | Bangli | Kakdi | Sitapur |
| Literate Women | 240 | 180 | 510 | 1150 |
| Illiterate Women | 320 | 720 | 170 | 130 |
Answer
612.9k+ views
Hint:
We will find the total number of women in each village. Then, we will calculate the percentage of literate and illiterate women in each village. We will represent these percentages on a bar diagram.
Formulas used: We will use the formula \[{\rm{Percentage}} = \dfrac{{{\rm{Value}}}}{{{\rm{Total Value }}}} \times 100\] to solve the question.
Complete step by step solution:
We will find the total number of women in village Haveli. It is the sum of literate and illiterate women of the village:
\[240 + 320 = 560\]
Now we will calculate the percentage of literate women in Haveli. We will substitute 240 for value and 560 for the total value in the formula \[{\rm{Percentage}} = \dfrac{{{\rm{Value}}}}{{{\rm{Total Value }}}} \times 100\]:
\[\dfrac{{240}}{{560}} \times 100 = 57.14\% \]
We will calculate the percentage of illiterate women in Haveli. We will substitute 320 for value and 560 for the total value in the formula \[{\rm{Percentage}} = \dfrac{{{\rm{Value}}}}{{{\rm{Total Value }}}} \times 100\]:
\[\dfrac{{320}}{{560}} \times 100 = 42.85\% \]
Again, we will repeat the above steps for the rest of the 3 villages as well.
We will find the total number of women in village Bangli:
\[180 + 720 = 900\]
We will calculate the percentage of literate women in Haveli. We will substitute 180 for value and 900 for the total value in the formula:
\[\dfrac{{180}}{{900}} \times 100 = 20\% \]
We will calculate the percentage of illiterate women in Haveli. We will substitute 720 for value and 900 for the total value in the formula:
\[\dfrac{{720}}{{900}} \times 100 = 80\% \]
We will find the total number of women in village Kakdi:
\[510 + 170 = 680\]
We will calculate the percentage of literate women in Kakdi. We will substitute 510 for value and 680 for the total value in the formula:
\[\dfrac{{510}}{{680}} \times 100 = 75\% \]
We will calculate the percentage of illiterate women in Kakdi. We will substitute 170 for value and 680 for the total value in the formula:
\[\dfrac{{170}}{{680}} \times 100 = 25\% \]
We will find the total number of women in village Sitapur:
\[1150 + 130 = 1280\]
We will calculate the percentage of literate women in Sitapur. We will substitute 1150 for value and 1280 for the total value in the formula:
\[\dfrac{{1150}}{{1280}} \times 100 = 83.33\% \]
We will calculate the percentage of illiterate women in Sitapur. We will substitute 130 for value and 1280 for the total value in the formula:
\[\dfrac{{130}}{{1280}} \times 100 = 16.66\% \]
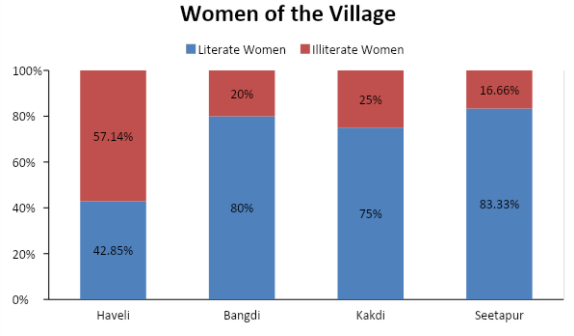
We have found the percentage of literate and illiterate women in each village. Now, we will represent this data in the form of a percentage bar diagram.
A convenient way to draw the percentage bar diagram is to first draw a bar of 10 units for each village. Each unit will represent 10 percentage points. Then we will draw a horizontal line at the height which represents the appropriate percentage of literate women in each village. The upper portion of the bar will automatically represent the percentage of illiterate women in each village. We don’t need to make any calculations for that. We can shade the lower portion representing literate women with blue colour and the upper portion representing illiterate women with red colour.
Note:
Percentage bar diagrams are basically a bar graph having subdivision on the basis of percentage. It has many practical applications. They are very useful when we have to compare the proportions of 2 or more categories across different sectors.
We will find the total number of women in each village. Then, we will calculate the percentage of literate and illiterate women in each village. We will represent these percentages on a bar diagram.
Formulas used: We will use the formula \[{\rm{Percentage}} = \dfrac{{{\rm{Value}}}}{{{\rm{Total Value }}}} \times 100\] to solve the question.
Complete step by step solution:
We will find the total number of women in village Haveli. It is the sum of literate and illiterate women of the village:
\[240 + 320 = 560\]
Now we will calculate the percentage of literate women in Haveli. We will substitute 240 for value and 560 for the total value in the formula \[{\rm{Percentage}} = \dfrac{{{\rm{Value}}}}{{{\rm{Total Value }}}} \times 100\]:
\[\dfrac{{240}}{{560}} \times 100 = 57.14\% \]
We will calculate the percentage of illiterate women in Haveli. We will substitute 320 for value and 560 for the total value in the formula \[{\rm{Percentage}} = \dfrac{{{\rm{Value}}}}{{{\rm{Total Value }}}} \times 100\]:
\[\dfrac{{320}}{{560}} \times 100 = 42.85\% \]
Again, we will repeat the above steps for the rest of the 3 villages as well.
We will find the total number of women in village Bangli:
\[180 + 720 = 900\]
We will calculate the percentage of literate women in Haveli. We will substitute 180 for value and 900 for the total value in the formula:
\[\dfrac{{180}}{{900}} \times 100 = 20\% \]
We will calculate the percentage of illiterate women in Haveli. We will substitute 720 for value and 900 for the total value in the formula:
\[\dfrac{{720}}{{900}} \times 100 = 80\% \]
We will find the total number of women in village Kakdi:
\[510 + 170 = 680\]
We will calculate the percentage of literate women in Kakdi. We will substitute 510 for value and 680 for the total value in the formula:
\[\dfrac{{510}}{{680}} \times 100 = 75\% \]
We will calculate the percentage of illiterate women in Kakdi. We will substitute 170 for value and 680 for the total value in the formula:
\[\dfrac{{170}}{{680}} \times 100 = 25\% \]
We will find the total number of women in village Sitapur:
\[1150 + 130 = 1280\]
We will calculate the percentage of literate women in Sitapur. We will substitute 1150 for value and 1280 for the total value in the formula:
\[\dfrac{{1150}}{{1280}} \times 100 = 83.33\% \]
We will calculate the percentage of illiterate women in Sitapur. We will substitute 130 for value and 1280 for the total value in the formula:
\[\dfrac{{130}}{{1280}} \times 100 = 16.66\% \]
We have found the percentage of literate and illiterate women in each village. Now, we will represent this data in the form of a percentage bar diagram.
A convenient way to draw the percentage bar diagram is to first draw a bar of 10 units for each village. Each unit will represent 10 percentage points. Then we will draw a horizontal line at the height which represents the appropriate percentage of literate women in each village. The upper portion of the bar will automatically represent the percentage of illiterate women in each village. We don’t need to make any calculations for that. We can shade the lower portion representing literate women with blue colour and the upper portion representing illiterate women with red colour.
Note:
Percentage bar diagrams are basically a bar graph having subdivision on the basis of percentage. It has many practical applications. They are very useful when we have to compare the proportions of 2 or more categories across different sectors.
Recently Updated Pages
Master Class 12 Economics: Engaging Questions & Answers for Success
Master Class 12 English: Engaging Questions & Answers for Success
Master Class 12 Social Science: Engaging Questions & Answers for Success
Master Class 12 Maths: Engaging Questions & Answers for Success
Master Class 12 Physics: Engaging Questions & Answers for Success
Master Class 9 General Knowledge: Engaging Questions & Answers for Success
Trending doubts
Explain the Treaty of Vienna of 1815 class 10 social science CBSE
Why is it 530 pm in india when it is 1200 afternoon class 10 social science CBSE
What is the full form of POSCO class 10 social science CBSE
Define Potential, Developed, Stock and Reserved resources
Which Country Has the Largest Border with India?
Complete the sentence with the most appropriate word class 10 english CBSE