


Draw a neat labeled energy level diagram and explain the different series of spectral lines for the hydrogen atom.
Answer
619.2k+ views
Hint: The electrons are transited from higher energy level to the lower energy levels. This causes the spectral lines of different wavelengths. The single electron orbiting around the nucleus of the hydrogen atom is explained by the Bohr model of the atom.
Complete step by step answer:
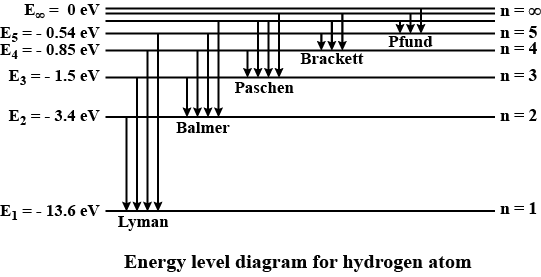
The energy level diagram of the hydrogen atom is given below.
When the electron transits from a higher energy level to a lower energy level photon is emitted. The energy of the photon is the difference in the energy of the states. The photon will emit with a frequency corresponding to the energy difference of the final and initial energy states. The energy of each state remains the same. Hence the emitted photon will always have the same frequency always.
The spectral lines are classified into series. The expression connecting the wavelength and the difference between the energy levels is described by the Rydberg formula.
$\dfrac{1}{\lambda } = {Z^2}R\left( {\dfrac{1}{{n_f^2}} - \dfrac{1}{{n_i^2}}} \right)$.
Where $\lambda $ is the wavelength, $Z$ is the atomic number, $R$ is the Rydberg constant, ${n_f}$ is the principal quantum number of the final state, and ${n_i}$ is the principal quantum number of the initial state.
The spectral lines including the transition of the electron to $n = 1$ energy state from the higher energy levels are called Lyman series. That is ${n_f} = 1$ and ${n_i} > 1$.
The spectral lines including the transition of the electron to $n = 2$ energy state from the higher energy levels are called Balmer series. That is ${n_f} = 2$ and ${n_i} > 2$.
The spectral lines including the transition of the electron to $n = 3$ energy state from the higher energy levels are called Paschen series. That is ${n_f} = 3$ and ${n_i} > 3$.
The spectral lines including the transition of the electron to $n = 4$ energy state from the higher energy levels are called Brackett series. That is ${n_f} = 4$ and ${n_i} > 4$.
The spectral lines including the transition of the electron to $n = 5$ energy state from the higher energy levels are called Pfund series. That is ${n_f} = 5$ and ${n_i} > 5$.
Note:
The wavelength will be higher for the transitions between adjacent energy levels. The Balmer series have wavelengths similar to the visible light. Hence they are visible. And the Paschen lies in the infrared region.
Complete step by step answer:
The energy level diagram of the hydrogen atom is given below.
When the electron transits from a higher energy level to a lower energy level photon is emitted. The energy of the photon is the difference in the energy of the states. The photon will emit with a frequency corresponding to the energy difference of the final and initial energy states. The energy of each state remains the same. Hence the emitted photon will always have the same frequency always.
The spectral lines are classified into series. The expression connecting the wavelength and the difference between the energy levels is described by the Rydberg formula.
$\dfrac{1}{\lambda } = {Z^2}R\left( {\dfrac{1}{{n_f^2}} - \dfrac{1}{{n_i^2}}} \right)$.
Where $\lambda $ is the wavelength, $Z$ is the atomic number, $R$ is the Rydberg constant, ${n_f}$ is the principal quantum number of the final state, and ${n_i}$ is the principal quantum number of the initial state.
The spectral lines including the transition of the electron to $n = 1$ energy state from the higher energy levels are called Lyman series. That is ${n_f} = 1$ and ${n_i} > 1$.
The spectral lines including the transition of the electron to $n = 2$ energy state from the higher energy levels are called Balmer series. That is ${n_f} = 2$ and ${n_i} > 2$.
The spectral lines including the transition of the electron to $n = 3$ energy state from the higher energy levels are called Paschen series. That is ${n_f} = 3$ and ${n_i} > 3$.
The spectral lines including the transition of the electron to $n = 4$ energy state from the higher energy levels are called Brackett series. That is ${n_f} = 4$ and ${n_i} > 4$.
The spectral lines including the transition of the electron to $n = 5$ energy state from the higher energy levels are called Pfund series. That is ${n_f} = 5$ and ${n_i} > 5$.
Note:
The wavelength will be higher for the transitions between adjacent energy levels. The Balmer series have wavelengths similar to the visible light. Hence they are visible. And the Paschen lies in the infrared region.
Recently Updated Pages
Master Class 12 Business Studies: Engaging Questions & Answers for Success
Master Class 12 Chemistry: Engaging Questions & Answers for Success
Master Class 12 Biology: Engaging Questions & Answers for Success
Class 12 Question and Answer - Your Ultimate Solutions Guide
Master Class 11 English: Engaging Questions & Answers for Success
Master Class 11 Social Science: Engaging Questions & Answers for Success
Trending doubts
Which are the Top 10 Largest Countries of the World?
Draw a labelled sketch of the human eye class 12 physics CBSE
The end of compass needle which points towards north class 12 physics CBSE
Differentiate between homogeneous and heterogeneous class 12 chemistry CBSE
In order to find out the different types of gametes class 12 biology NEET_UG
Why is the cell called the structural and functional class 12 biology CBSE