


Draw a histogram to represent the following data.
Class intervals: $01$-$1010$-$2020$-$3030$-$4040$-$5050$-$60$
Frequency: $8$ $12$ $6$ $14$ $10$ $5$
Answer
611.4k+ views
Hint:
Here we have to draw a histogram with the given class interval and given frequency. First, we will draw x-axis and y-axis and we will name x-axis as class intervals and y-axis as frequency. Then we will draw the bars on the x-axis with proper area. For that we need its width as well as height. We will find its width using the class intervals and its height will be equal to its frequency.
Complete step by step solution:
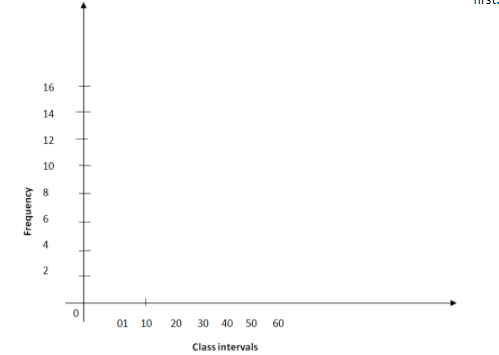
To draw the histogram, we will first draw x-axis and y-axis and then we will name the x-axis as class interval and y-axis as frequency and we will mark the class intervals on the x-axis from the given data and we will label the frequency on the y-axis with proper difference of $2$. Let’s draw the axes and label it first.
Now, we will draw bars on the x-axis whose width will be equal to the difference of the upper and lower limit of class and height will be equal to frequency given for each class interval. Similarly, we will draw bars for the other intervals also. The widths of all the bars will be equal to the difference of the upper and lower limit of their respective class interval.
Let’s draw the bar now.
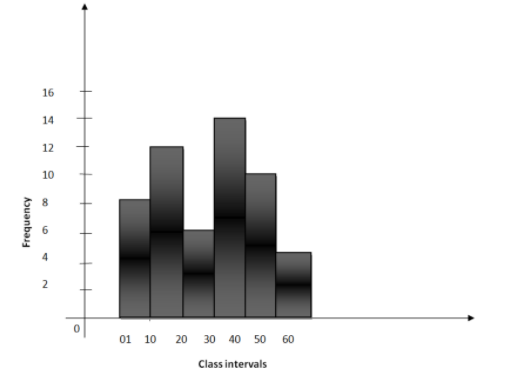
This is the required histogram of given class intervals and given frequency.
Note:
Since this question is all about histogram. Let’s understand it deeply. A histogram is a way of representing the data pictorially. It looks similar to a bar graph but there are some differences between the two.
1) Histograms represent quantitative data but bar graphs represent categorical data.
2) In histogram, there are no spaces between the bars which we use but in the bar graph, there are spaces between the bars.
In histogram, it’s not necessary for the bars to have the same width but the width of bars in the bar graph is the same.
Here we have to draw a histogram with the given class interval and given frequency. First, we will draw x-axis and y-axis and we will name x-axis as class intervals and y-axis as frequency. Then we will draw the bars on the x-axis with proper area. For that we need its width as well as height. We will find its width using the class intervals and its height will be equal to its frequency.
Complete step by step solution:
To draw the histogram, we will first draw x-axis and y-axis and then we will name the x-axis as class interval and y-axis as frequency and we will mark the class intervals on the x-axis from the given data and we will label the frequency on the y-axis with proper difference of $2$. Let’s draw the axes and label it first.
Now, we will draw bars on the x-axis whose width will be equal to the difference of the upper and lower limit of class and height will be equal to frequency given for each class interval. Similarly, we will draw bars for the other intervals also. The widths of all the bars will be equal to the difference of the upper and lower limit of their respective class interval.
Let’s draw the bar now.
This is the required histogram of given class intervals and given frequency.
Note:
Since this question is all about histogram. Let’s understand it deeply. A histogram is a way of representing the data pictorially. It looks similar to a bar graph but there are some differences between the two.
1) Histograms represent quantitative data but bar graphs represent categorical data.
2) In histogram, there are no spaces between the bars which we use but in the bar graph, there are spaces between the bars.
In histogram, it’s not necessary for the bars to have the same width but the width of bars in the bar graph is the same.
Recently Updated Pages
Master Class 12 Economics: Engaging Questions & Answers for Success
Master Class 12 English: Engaging Questions & Answers for Success
Master Class 12 Social Science: Engaging Questions & Answers for Success
Master Class 12 Maths: Engaging Questions & Answers for Success
Master Class 12 Physics: Engaging Questions & Answers for Success
Master Class 9 General Knowledge: Engaging Questions & Answers for Success
Trending doubts
Explain the Treaty of Vienna of 1815 class 10 social science CBSE
Who Won 36 Oscar Awards? Record Holder Revealed
Why is it 530 pm in india when it is 1200 afternoon class 10 social science CBSE
Make a sketch of the human nerve cell What function class 10 biology CBSE
What is the full form of POSCO class 10 social science CBSE
Define Potential, Developed, Stock and Reserved resources