


Draw a graph of the equation \[x = 0\], \[y = 0\].
Answer
595.8k+ views
Hint:
Here, we need to draw the graph of the equations \[x = 0\], \[y = 0\]. We will rewrite the given equations and find any three points satisfying the equations. Then, we will join the points and extend the line on either side to get the graph of the required equation.
Complete step by step solution:
First, we will draw the graph of the equation \[x = 0\].
Rewriting the equation, we get
\[ \Rightarrow x + 0 = 0\]
Since any number, variable, or expression multiplied by 0 results in 0, we can rewrite the expression as
\[ \Rightarrow x + \left( {0 \times y} \right) = 0\]
Now, we will find the points that satisfy this equation.
We will substitute some values of \[y\] to find the corresponding values of \[x\], and hence, find the points lying on the graph of the equation \[x = 0\].
Substituting \[y = 1\] in the equation \[x + \left( {0 \times y} \right) = 0\], we get
\[ \Rightarrow x + \left( {0 \times 1} \right) = 0\]
Multiplying the terms in the expression, we get
\[ \Rightarrow x + 0 = 0\]
Adding the terms in the expression, we get
\[ \Rightarrow x = 0\]
Thus, if \[y = 1\], then \[x = 0\].
Therefore, the point \[\left( {0,1} \right)\] lies on the graph of the equation \[x = 0\].
Substituting \[y = 2\] in the equation \[x + \left( {0 \times y} \right) = 0\], we get
\[ \Rightarrow x + \left( {0 \times 2} \right) = 0\]
Multiplying the terms in the expression, we get
\[ \Rightarrow x + 0 = 0\]
Adding the terms in the expression, we get
\[ \Rightarrow x = 0\]
Thus, if \[y = 2\], then \[x = 0\].
Therefore, the point \[\left( {0,2} \right)\] lies on the graph of the equation \[x = 0\].
Substituting \[y = 3\] in the equation \[x + \left( {0 \times y} \right) = 0\], we get
\[ \Rightarrow x + \left( {0 \times 3} \right) = 0\]
Multiplying the terms in the expression, we get
\[ \Rightarrow x + 0 = 0\]
Adding the terms in the expression, we get
\[ \Rightarrow x = 0\]
Thus, if \[y = 3\], then \[x = 0\].
Therefore, the point \[\left( {0,3} \right)\] lies on the graph of the equation \[x = 0\].
We can observe that the points \[\left( {0,1} \right)\], \[\left( {0,2} \right)\], and \[\left( {0,3} \right)\] lie on the graph of the equation \[x = 0\].
We will plot the points \[\left( {0,1} \right)\], \[\left( {0,2} \right)\], and \[\left( {0,3} \right)\] on a graph, join them, and extend the line on either sides to get the required graph of the equation \[x = 0\].
Therefore, we get the graph of \[x = 0\] as
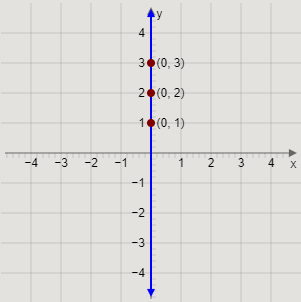
Here, the blue coloured line is the line \[x = 0\].
Next, we will draw the graph of the equation \[y = 0\].
Rewriting the equation, we get
\[ \Rightarrow 0 + y = 0\]
Since any number, variable, or expression multiplied by 0 results in 0, we can rewrite the expression as
\[ \Rightarrow \left( {0 \times x} \right) + y = 0\]
Now, we will find the points that satisfy this equation.
We will substitute some values of \[x\] to find the corresponding values of \[y\], and hence, find the points lying on the graph of the equation \[y = 0\].
Substituting \[x = 1\] in the equation \[\left( {0 \times x} \right) + y = 0\], we get
\[ \Rightarrow \left( {0 \times 1} \right) + y = 0\]
Multiplying the terms in the expression, we get
\[ \Rightarrow 0 + y = 0\]
Adding the terms in the expression, we get
\[ \Rightarrow y = 0\]
Thus, if \[x = 1\], then \[y = 0\].
Therefore, the point \[\left( {1,0} \right)\] lies on the graph of the equation \[y = 0\].
Substituting \[x = 2\] in the equation \[\left( {0 \times x} \right) + y = 0\], we get
\[ \Rightarrow \left( {0 \times 2} \right) + y = 0\]
Multiplying the terms in the expression, we get
\[ \Rightarrow 0 + y = 0\]
Adding the terms in the expression, we get
\[ \Rightarrow y = 0\]
Thus, if \[x = 2\], then \[y = 0\].
Therefore, the point \[\left( {2,0} \right)\] lies on the graph of the equation \[y = 0\].
Substituting \[x = 3\] in the equation \[\left( {0 \times x} \right) + y = 0\], we get
\[ \Rightarrow \left( {0 \times 3} \right) + y = 0\]
Multiplying the terms in the expression, we get
\[ \Rightarrow 0 + y = 0\]
Adding the terms in the expression, we get
\[ \Rightarrow y = 0\]
Thus, if \[x = 3\], then \[y = 0\].
Therefore, the point \[\left( {3,0} \right)\] lies on the graph of the equation \[y = 0\].
We can observe that the points \[\left( {1,0} \right)\], \[\left( {2,0} \right)\], and \[\left( {3,0} \right)\] lie on the graph of the equation \[y = 0\].
We will plot the points \[\left( {1,0} \right)\], \[\left( {2,0} \right)\], and \[\left( {3,0} \right)\] on a graph, join them, and extend the line on either sides to get the required graph of the equation \[y = 0\].
Therefore, we get the graph of \[y = 0\] as
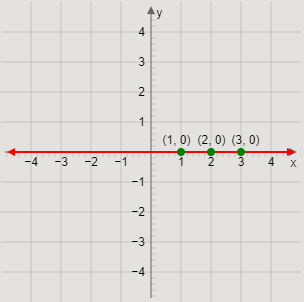
Here, the red coloured line is the line \[y = 0\].
Note:
We can observe that the graph of the equation \[x = 0\] coincides with the \[y\]–axis. This is because a line parallel to the \[y\]–axis is of the form \[x + a = 0\], where \[a\] is not equal to 0. Here, If \[a\] is equal to 0, then the line becomes \[x = 0\], which is coincident with the \[y\]–axis. At this line, the value of \[x\] is always 0, irrespective of the value of \[y\].
Similarly, we can observe that the graph of the equation \[y = 0\] coincides with the \[x\]–axis. At this line, the value of \[y\] is always 0, irrespective of the value of \[x\].
Here, we need to draw the graph of the equations \[x = 0\], \[y = 0\]. We will rewrite the given equations and find any three points satisfying the equations. Then, we will join the points and extend the line on either side to get the graph of the required equation.
Complete step by step solution:
First, we will draw the graph of the equation \[x = 0\].
Rewriting the equation, we get
\[ \Rightarrow x + 0 = 0\]
Since any number, variable, or expression multiplied by 0 results in 0, we can rewrite the expression as
\[ \Rightarrow x + \left( {0 \times y} \right) = 0\]
Now, we will find the points that satisfy this equation.
We will substitute some values of \[y\] to find the corresponding values of \[x\], and hence, find the points lying on the graph of the equation \[x = 0\].
Substituting \[y = 1\] in the equation \[x + \left( {0 \times y} \right) = 0\], we get
\[ \Rightarrow x + \left( {0 \times 1} \right) = 0\]
Multiplying the terms in the expression, we get
\[ \Rightarrow x + 0 = 0\]
Adding the terms in the expression, we get
\[ \Rightarrow x = 0\]
Thus, if \[y = 1\], then \[x = 0\].
Therefore, the point \[\left( {0,1} \right)\] lies on the graph of the equation \[x = 0\].
Substituting \[y = 2\] in the equation \[x + \left( {0 \times y} \right) = 0\], we get
\[ \Rightarrow x + \left( {0 \times 2} \right) = 0\]
Multiplying the terms in the expression, we get
\[ \Rightarrow x + 0 = 0\]
Adding the terms in the expression, we get
\[ \Rightarrow x = 0\]
Thus, if \[y = 2\], then \[x = 0\].
Therefore, the point \[\left( {0,2} \right)\] lies on the graph of the equation \[x = 0\].
Substituting \[y = 3\] in the equation \[x + \left( {0 \times y} \right) = 0\], we get
\[ \Rightarrow x + \left( {0 \times 3} \right) = 0\]
Multiplying the terms in the expression, we get
\[ \Rightarrow x + 0 = 0\]
Adding the terms in the expression, we get
\[ \Rightarrow x = 0\]
Thus, if \[y = 3\], then \[x = 0\].
Therefore, the point \[\left( {0,3} \right)\] lies on the graph of the equation \[x = 0\].
We can observe that the points \[\left( {0,1} \right)\], \[\left( {0,2} \right)\], and \[\left( {0,3} \right)\] lie on the graph of the equation \[x = 0\].
We will plot the points \[\left( {0,1} \right)\], \[\left( {0,2} \right)\], and \[\left( {0,3} \right)\] on a graph, join them, and extend the line on either sides to get the required graph of the equation \[x = 0\].
Therefore, we get the graph of \[x = 0\] as
Here, the blue coloured line is the line \[x = 0\].
Next, we will draw the graph of the equation \[y = 0\].
Rewriting the equation, we get
\[ \Rightarrow 0 + y = 0\]
Since any number, variable, or expression multiplied by 0 results in 0, we can rewrite the expression as
\[ \Rightarrow \left( {0 \times x} \right) + y = 0\]
Now, we will find the points that satisfy this equation.
We will substitute some values of \[x\] to find the corresponding values of \[y\], and hence, find the points lying on the graph of the equation \[y = 0\].
Substituting \[x = 1\] in the equation \[\left( {0 \times x} \right) + y = 0\], we get
\[ \Rightarrow \left( {0 \times 1} \right) + y = 0\]
Multiplying the terms in the expression, we get
\[ \Rightarrow 0 + y = 0\]
Adding the terms in the expression, we get
\[ \Rightarrow y = 0\]
Thus, if \[x = 1\], then \[y = 0\].
Therefore, the point \[\left( {1,0} \right)\] lies on the graph of the equation \[y = 0\].
Substituting \[x = 2\] in the equation \[\left( {0 \times x} \right) + y = 0\], we get
\[ \Rightarrow \left( {0 \times 2} \right) + y = 0\]
Multiplying the terms in the expression, we get
\[ \Rightarrow 0 + y = 0\]
Adding the terms in the expression, we get
\[ \Rightarrow y = 0\]
Thus, if \[x = 2\], then \[y = 0\].
Therefore, the point \[\left( {2,0} \right)\] lies on the graph of the equation \[y = 0\].
Substituting \[x = 3\] in the equation \[\left( {0 \times x} \right) + y = 0\], we get
\[ \Rightarrow \left( {0 \times 3} \right) + y = 0\]
Multiplying the terms in the expression, we get
\[ \Rightarrow 0 + y = 0\]
Adding the terms in the expression, we get
\[ \Rightarrow y = 0\]
Thus, if \[x = 3\], then \[y = 0\].
Therefore, the point \[\left( {3,0} \right)\] lies on the graph of the equation \[y = 0\].
We can observe that the points \[\left( {1,0} \right)\], \[\left( {2,0} \right)\], and \[\left( {3,0} \right)\] lie on the graph of the equation \[y = 0\].
We will plot the points \[\left( {1,0} \right)\], \[\left( {2,0} \right)\], and \[\left( {3,0} \right)\] on a graph, join them, and extend the line on either sides to get the required graph of the equation \[y = 0\].
Therefore, we get the graph of \[y = 0\] as
Here, the red coloured line is the line \[y = 0\].
Note:
We can observe that the graph of the equation \[x = 0\] coincides with the \[y\]–axis. This is because a line parallel to the \[y\]–axis is of the form \[x + a = 0\], where \[a\] is not equal to 0. Here, If \[a\] is equal to 0, then the line becomes \[x = 0\], which is coincident with the \[y\]–axis. At this line, the value of \[x\] is always 0, irrespective of the value of \[y\].
Similarly, we can observe that the graph of the equation \[y = 0\] coincides with the \[x\]–axis. At this line, the value of \[y\] is always 0, irrespective of the value of \[x\].
Recently Updated Pages
Master Class 11 Social Science: Engaging Questions & Answers for Success
Master Class 11 English: Engaging Questions & Answers for Success
Master Class 11 Maths: Engaging Questions & Answers for Success
Master Class 11 Chemistry: Engaging Questions & Answers for Success
Master Class 11 Biology: Engaging Questions & Answers for Success
Master Class 11 Physics: Engaging Questions & Answers for Success
Trending doubts
Differentiate between an exothermic and an endothermic class 11 chemistry CBSE
There are 720 permutations of the digits 1 2 3 4 5 class 11 maths CBSE
Draw a diagram of a plant cell and label at least eight class 11 biology CBSE
Which chemical is known as king of chemicals A H 2 class 11 chemistry CBSE
Which gas is abundant in air class 11 chemistry CBSE
Draw a diagram of nephron and explain its structur class 11 biology CBSE