


What does velocity versus time graphs show ?
Answer
546k+ views
Hint:Graphs are an important part of physics. For drawing any graph there are certain perquisites which must be satisfied. Usually a graph is drawn out between two quantities which may or may not be dependent on each other. We require two axes. Generally, the graphs are drawn out on x axis and y axis respectively. Graphs can be linear or nonlinear. It is not necessary that all the curves will pass through the origin.
Complete answer:
axis. We have drawn here a velocity time graph and we can see that it is a straight line passing through the origin. So, at time t=0, the particle is at rest. Also, the slope is constant for this curve. Also, the slope is constant for this curve. Also, the area under the velocity time graph gives us displacement and the slope gives us acceleration.
We know velocity is given by $v=\dfrac{\Delta x}{\Delta t}$ that is the ratio of displacement to the time taken. So, any curve drawn for velocity versus time, it will show the variation of the change of the velocity of the body with respect to time. The two axes with the names are shown below:
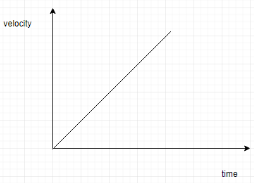
Now there can be a possibility that at time, t=0 s, the velocity of the particle may be zero or not. If the velocity of the particle is zero at time, t=0, the velocity time graph will pass through the origin.
Note: There is a thing called slope which can be find out for any curve and is given by the formula $m=\dfrac{{{y}_{2}}-{{y}_{1}}}{{{x}_{2}}-{{x}_{1}}}$. The slope gives the ratio of the difference of the y and x coordinates of any two points which is taken on the curve and these two points must lie on a straight line. Slope can be positive as well as negative and zero as well.
Complete answer:
axis. We have drawn here a velocity time graph and we can see that it is a straight line passing through the origin. So, at time t=0, the particle is at rest. Also, the slope is constant for this curve. Also, the slope is constant for this curve. Also, the area under the velocity time graph gives us displacement and the slope gives us acceleration.
We know velocity is given by $v=\dfrac{\Delta x}{\Delta t}$ that is the ratio of displacement to the time taken. So, any curve drawn for velocity versus time, it will show the variation of the change of the velocity of the body with respect to time. The two axes with the names are shown below:
Now there can be a possibility that at time, t=0 s, the velocity of the particle may be zero or not. If the velocity of the particle is zero at time, t=0, the velocity time graph will pass through the origin.
Note: There is a thing called slope which can be find out for any curve and is given by the formula $m=\dfrac{{{y}_{2}}-{{y}_{1}}}{{{x}_{2}}-{{x}_{1}}}$. The slope gives the ratio of the difference of the y and x coordinates of any two points which is taken on the curve and these two points must lie on a straight line. Slope can be positive as well as negative and zero as well.
Recently Updated Pages
Master Class 11 English: Engaging Questions & Answers for Success
Master Class 11 Maths: Engaging Questions & Answers for Success
Master Class 11 Biology: Engaging Questions & Answers for Success
Master Class 11 Physics: Engaging Questions & Answers for Success
Master Class 11 Accountancy: Engaging Questions & Answers for Success
Class 11 Question and Answer - Your Ultimate Solutions Guide
Trending doubts
Difference Between Plant Cell and Animal Cell
Fill the blanks with the suitable prepositions 1 The class 9 english CBSE
Which places in India experience sunrise first and class 9 social science CBSE
What is pollution? How many types of pollution? Define it
Name 10 Living and Non living things class 9 biology CBSE
What is the full form of pH?