


How does Maxwell-Boltzmann distribution work?
Answer
563.4k+ views
Hint: To understand Maxwell-Boltzmann distribution, first we need to know what an ideal gas is. An ideal gas is a gas in which the molecules neither attract nor repel each other and the molecules do not occupy any space themselves.
Complete answer:
We know that the speed of all the air molecules around us is not the same. While the speed of some molecules is extremely fast, the speed of others could be very slow. Hence one cannot accurately determine the speed of a molecule in air.
To solve this unanswered question, Ludwig Boltzmann and James Clerk Maxwell derived the Maxwell-Boltzmann distribution. It gives the distribution of speed of molecules in an ideal gas at a certain temperature. The following graph is used to represent the Maxwell-Boltzmann distribution.
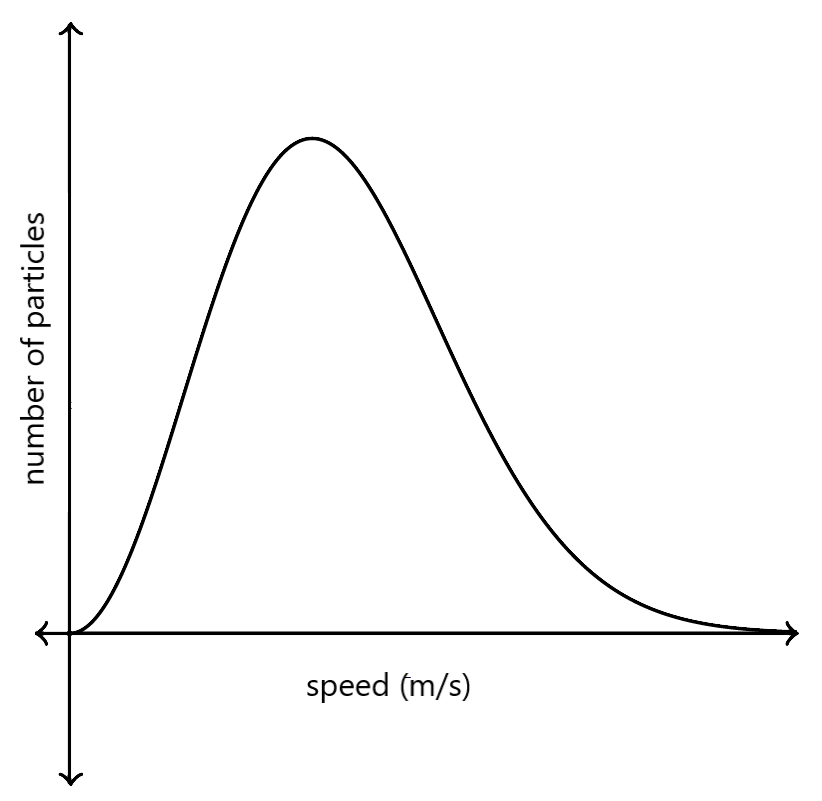
The graph is not symmetrical in nature. The number of particles having extremely high speed towards the right are nearing zero, and have a longer tail.
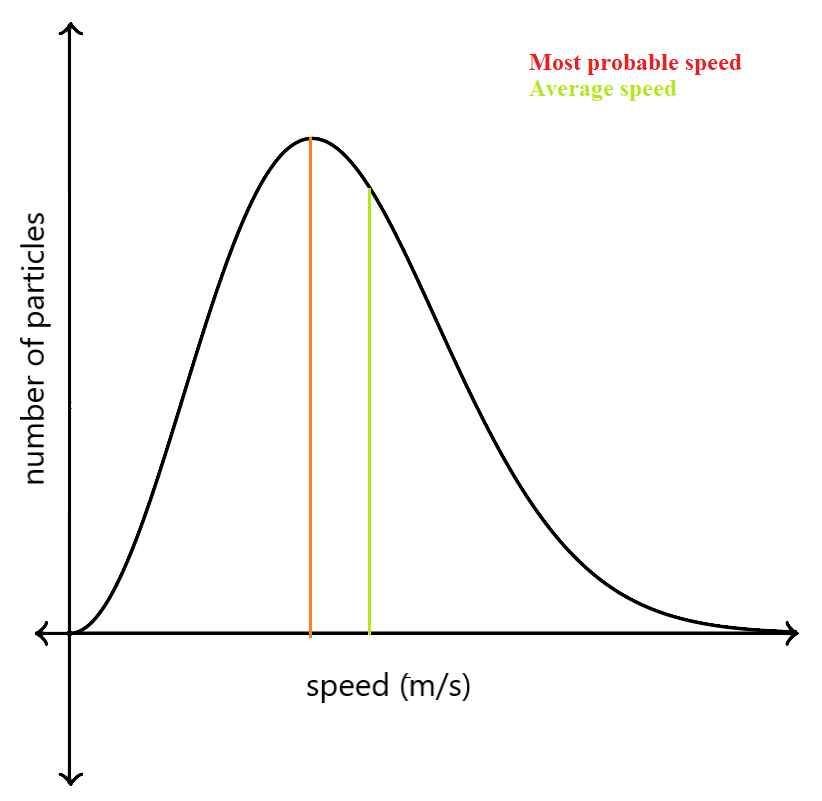
One could assume that the average speed of the particles is at the peak of the graph, but that’s false. The peak depicts the most probable speed of the molecules, that is, the speed which is most probable for a gas molecule.
The average speed, a little bit right to the most probable speed, is shown with the green line in the graph below. Due to the longer tail of the graph towards the right, the average speed shifts to the right of the most probable speed.
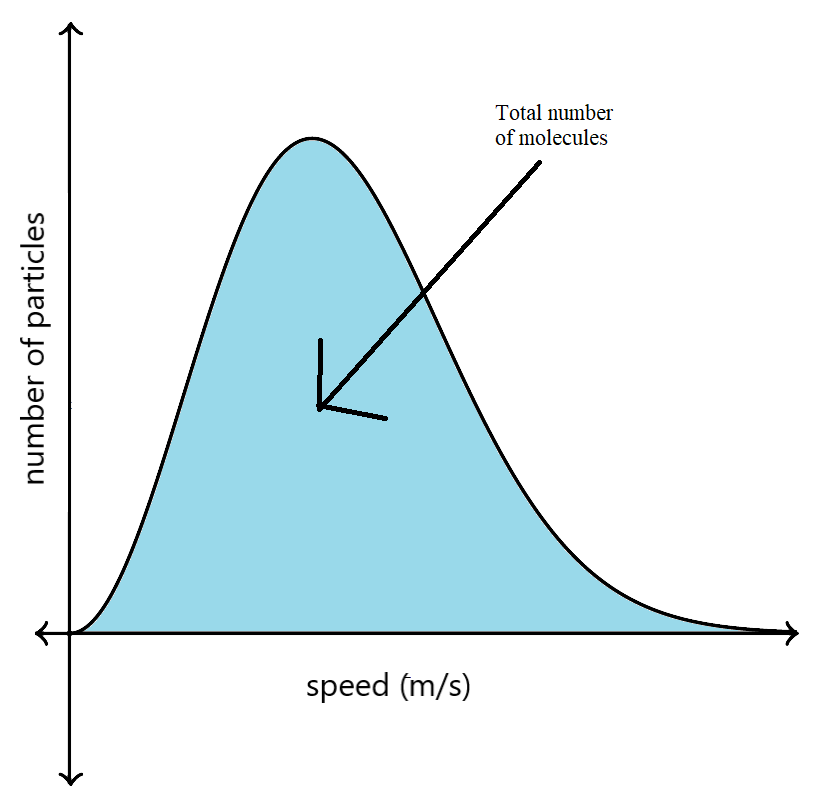
Now, the area under the Maxwell-Boltzmann distribution graph shows the total number of molecules in a gas.
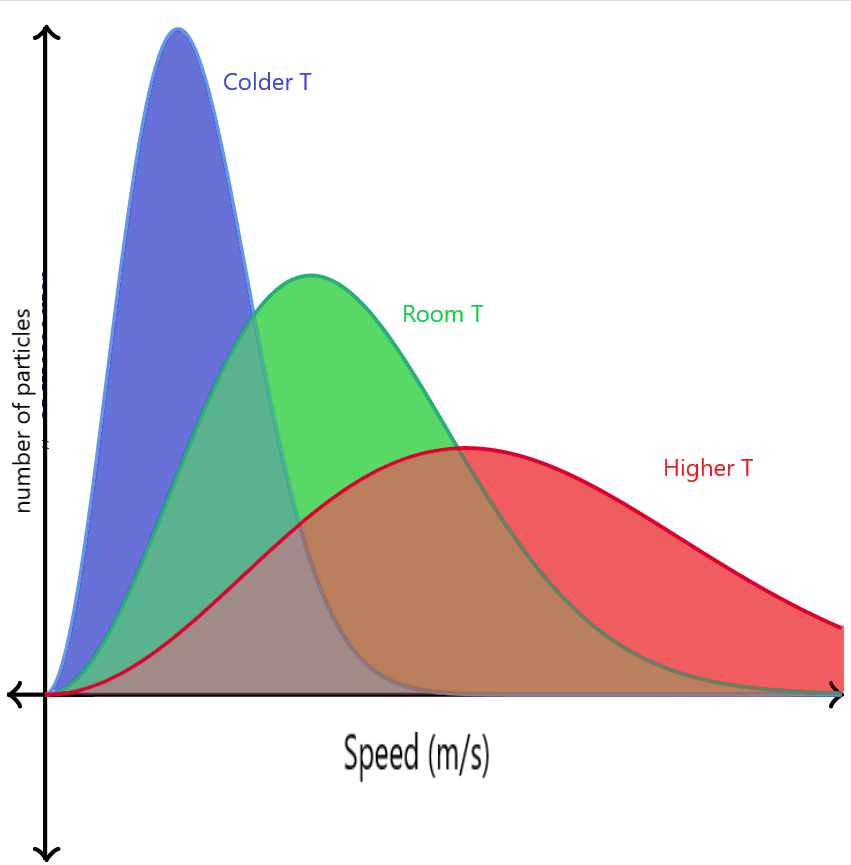
Let us see how the change in temperature affects the Maxwell-Boltzmann distribution graph when the number of molecules is the same.
- If the temperature of the gas is increased, the average kinetic energy of the system will increase, hence the speed of the molecules will increase, and hence the peak will shift towards the right. But since the number of molecules remains constant, the area under the curve will also remain the same, and hence the peak will decrease in height along the y-axis. The overall peak will be smaller and wider.
- If the temperature of the gas is decreased, the average kinetic energy of the system will decrease, hence the speed of the molecules will decrease, and hence the peak will shift towards the left. But since the number of molecules remains constant, the area under the curve will also remain the same, and hence the peak will increase in height along the y-axis. The overall peak will be taller and narrow.
This is how the Maxwell-Boltzmann distribution graph works.
Note:
It should be noted that if new molecules are introduced in the sample, the area under the Maxwell-Boltzmann distribution graph would increase. Similarly, if molecules are removed from the sample, the area under the Maxwell-Boltzmann distribution graph would decrease.
Complete answer:
We know that the speed of all the air molecules around us is not the same. While the speed of some molecules is extremely fast, the speed of others could be very slow. Hence one cannot accurately determine the speed of a molecule in air.
To solve this unanswered question, Ludwig Boltzmann and James Clerk Maxwell derived the Maxwell-Boltzmann distribution. It gives the distribution of speed of molecules in an ideal gas at a certain temperature. The following graph is used to represent the Maxwell-Boltzmann distribution.
The graph is not symmetrical in nature. The number of particles having extremely high speed towards the right are nearing zero, and have a longer tail.
One could assume that the average speed of the particles is at the peak of the graph, but that’s false. The peak depicts the most probable speed of the molecules, that is, the speed which is most probable for a gas molecule.
The average speed, a little bit right to the most probable speed, is shown with the green line in the graph below. Due to the longer tail of the graph towards the right, the average speed shifts to the right of the most probable speed.
Now, the area under the Maxwell-Boltzmann distribution graph shows the total number of molecules in a gas.
Let us see how the change in temperature affects the Maxwell-Boltzmann distribution graph when the number of molecules is the same.
- If the temperature of the gas is increased, the average kinetic energy of the system will increase, hence the speed of the molecules will increase, and hence the peak will shift towards the right. But since the number of molecules remains constant, the area under the curve will also remain the same, and hence the peak will decrease in height along the y-axis. The overall peak will be smaller and wider.
- If the temperature of the gas is decreased, the average kinetic energy of the system will decrease, hence the speed of the molecules will decrease, and hence the peak will shift towards the left. But since the number of molecules remains constant, the area under the curve will also remain the same, and hence the peak will increase in height along the y-axis. The overall peak will be taller and narrow.
This is how the Maxwell-Boltzmann distribution graph works.
Note:
It should be noted that if new molecules are introduced in the sample, the area under the Maxwell-Boltzmann distribution graph would increase. Similarly, if molecules are removed from the sample, the area under the Maxwell-Boltzmann distribution graph would decrease.
Recently Updated Pages
Master Class 12 Business Studies: Engaging Questions & Answers for Success
Master Class 12 Biology: Engaging Questions & Answers for Success
Master Class 12 Chemistry: Engaging Questions & Answers for Success
Class 12 Question and Answer - Your Ultimate Solutions Guide
Master Class 11 Social Science: Engaging Questions & Answers for Success
Master Class 11 English: Engaging Questions & Answers for Success
Trending doubts
Which is more stable and why class 12 chemistry CBSE
What are the major means of transport Explain each class 12 social science CBSE
Sulphuric acid is known as the king of acids State class 12 chemistry CBSE
The value of constant k in coulombs law is beginalign class 12 physics CBSE
Why should a magnesium ribbon be cleaned before burning class 12 chemistry CBSE
Suicide bags of cells are aEndoplasmic reticulum bLysosome class 12 biology CBSE