


What does a high and a low z-score mean?
Answer
480.3k+ views
Hint: To do this question first we should know what low and high z-score mean. A high z-score means a very low probability of data above this z-score and a low z-score means a very low probability of data below this z-score.
Complete answer:
A high z-score means a very low probability of data above the z-score. For example, the figure below shows the probability of a z-score above $2.6$.
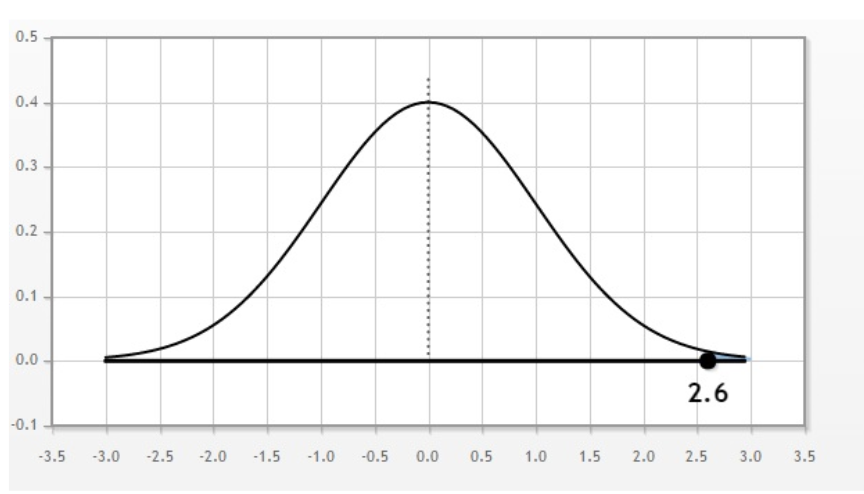
Probability for this is $0.47\% $, which is less than half-percent. Note that if z-score rises further, area under the curve falls and probability reduces further.
A low z-score means a very low probability of data below this z-score. The figure below shows the probability of a z-score below $ - 2.5$.
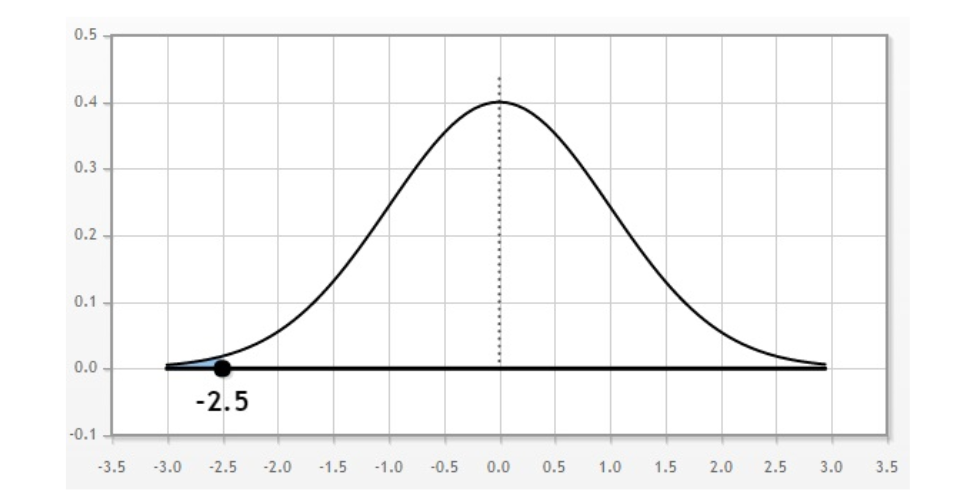
Probability for this is $0.62\% $ and note that if z-score falls further, area under the curve falls and probability reduces further.
Note: Z-score can be defined as the number of standard deviations from the mean. A data point is a measure of how many standard deviations below or above mean. A raw score as a Z-score can also be called as a standard score and it can be placed on a normal distribution curve. Z-scores range from $ - 3$ standard deviations up to $ + 3$ standards. A Z-score can help us in determining the difference or the distance between a value and the mean value. When you "standardize" a variable, its mean becomes zero and its standard deviation becomes one.
Complete answer:
A high z-score means a very low probability of data above the z-score. For example, the figure below shows the probability of a z-score above $2.6$.
Probability for this is $0.47\% $, which is less than half-percent. Note that if z-score rises further, area under the curve falls and probability reduces further.
A low z-score means a very low probability of data below this z-score. The figure below shows the probability of a z-score below $ - 2.5$.
Probability for this is $0.62\% $ and note that if z-score falls further, area under the curve falls and probability reduces further.
Note: Z-score can be defined as the number of standard deviations from the mean. A data point is a measure of how many standard deviations below or above mean. A raw score as a Z-score can also be called as a standard score and it can be placed on a normal distribution curve. Z-scores range from $ - 3$ standard deviations up to $ + 3$ standards. A Z-score can help us in determining the difference or the distance between a value and the mean value. When you "standardize" a variable, its mean becomes zero and its standard deviation becomes one.
Recently Updated Pages
Master Class 11 Computer Science: Engaging Questions & Answers for Success
Master Class 11 Business Studies: Engaging Questions & Answers for Success
Master Class 11 Economics: Engaging Questions & Answers for Success
Master Class 11 English: Engaging Questions & Answers for Success
Master Class 11 Maths: Engaging Questions & Answers for Success
Master Class 11 Biology: Engaging Questions & Answers for Success
Trending doubts
One Metric ton is equal to kg A 10000 B 1000 C 100 class 11 physics CBSE
There are 720 permutations of the digits 1 2 3 4 5 class 11 maths CBSE
Discuss the various forms of bacteria class 11 biology CBSE
Draw a diagram of a plant cell and label at least eight class 11 biology CBSE
State the laws of reflection of light
Explain zero factorial class 11 maths CBSE