


Complete the given table and draw a graph of the line ?
$x$ $0$ $1$ $2$ $3$ \[y = 3x + 1\] $1$ 4
| $x$ | $0$ | $1$ | $2$ | $3$ |
| \[y = 3x + 1\] | $1$ | 4 |
Answer
564.3k+ views
Hint: In the given question, we are given a function in variables x and y. The given function represents a straight line on the Cartesian plane. A graph of a function f is the set of ordered pairs; the equation of graph is generally represented as $y = f\left( x \right)$, where x and f(x) are real numbers. We substitute the value of x and we determine the value of y and then we mark the points in the graph and we join the points.
Complete step-by-step answer:
Here in this question, we have to first complete the given table by filling up the missing values of y by substituting the values of x in the function given to us. Then, we have to plot the graph for the given equation of line on the Cartesian plane.
These pairs or points are in the form of Cartesian form and the graph is the two-dimensional graph.
First, we have to find the missing values of y by using the graph equation \[y = 3x + 1\] for the given values of x.
So, Let us substitute the value of x as $2$. So, we get the value of y as
\[ \Rightarrow y = 3\left( 2 \right) + 1\]
$ \Rightarrow y = 6 + 1 = 7$
Now we consider the value of x as $3$, the value of y is
\[ \Rightarrow y = 3\left( 3 \right) + 1\]
\[ \Rightarrow y = 9 + 1\]
$ \Rightarrow y = 10$
Now, we complete the given table by filling up the missing values. So, we get,
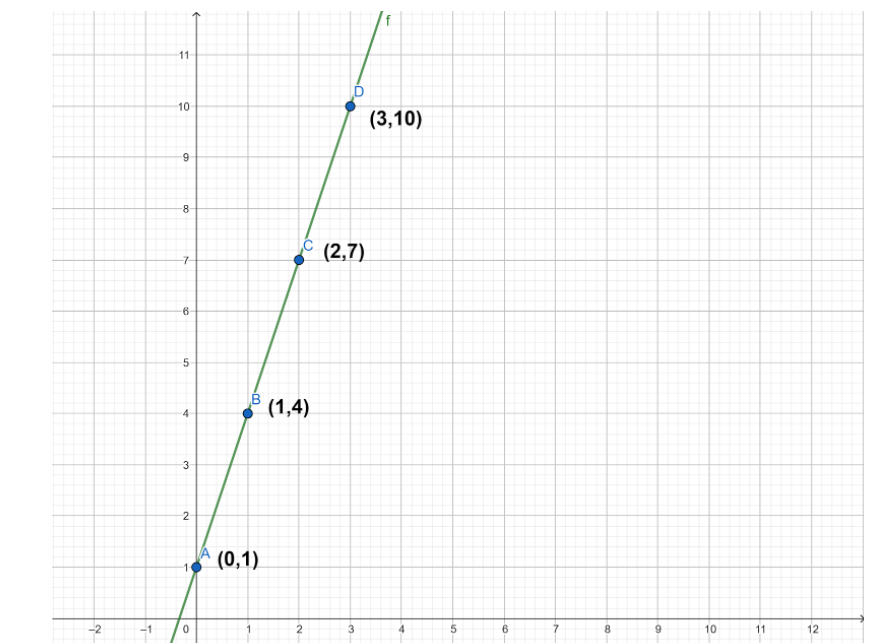
The graph plotted for the equation of the line using these points is represented below:
Note: The graph plotted is of two dimensional. The graph is plotted in x-axis versus y axis. By the equation of a graph, we can plot the graph by assuming the value of x. We can’t assume the value of y because the value of y depends on the value of x.
Complete step-by-step answer:
Here in this question, we have to first complete the given table by filling up the missing values of y by substituting the values of x in the function given to us. Then, we have to plot the graph for the given equation of line on the Cartesian plane.
These pairs or points are in the form of Cartesian form and the graph is the two-dimensional graph.
First, we have to find the missing values of y by using the graph equation \[y = 3x + 1\] for the given values of x.
So, Let us substitute the value of x as $2$. So, we get the value of y as
\[ \Rightarrow y = 3\left( 2 \right) + 1\]
$ \Rightarrow y = 6 + 1 = 7$
Now we consider the value of x as $3$, the value of y is
\[ \Rightarrow y = 3\left( 3 \right) + 1\]
\[ \Rightarrow y = 9 + 1\]
$ \Rightarrow y = 10$
Now, we complete the given table by filling up the missing values. So, we get,
| $x$ | $0$ | $1$ | $2$ | $3$ |
| \[y = 3x + 1\] | $1$ | 4 | $7$ | $10$ |
The graph plotted for the equation of the line using these points is represented below:
Note: The graph plotted is of two dimensional. The graph is plotted in x-axis versus y axis. By the equation of a graph, we can plot the graph by assuming the value of x. We can’t assume the value of y because the value of y depends on the value of x.
Recently Updated Pages
Master Class 11 English: Engaging Questions & Answers for Success
Master Class 11 Social Science: Engaging Questions & Answers for Success
Master Class 11 Maths: Engaging Questions & Answers for Success
Master Class 11 Biology: Engaging Questions & Answers for Success
Master Class 11 Physics: Engaging Questions & Answers for Success
Master Class 11 Chemistry: Engaging Questions & Answers for Success
Trending doubts
In Indian rupees 1 trillion is equal to how many c class 8 maths CBSE
What are the 12 elements of nature class 8 chemistry CBSE
Which of the following leader has given the term insensate class 8 social science CBSE
Name the states through which the Tropic of Cancer class 8 social science CBSE
Give me the opposite gender of Duck class 8 english CBSE
a Define matter Give four examples of matter b What class 8 chemistry CBSE