


Complete the following table to draw the graph of $ y = 2x + 1 $
X 2 -2 ............ ........... Y ................... ............... -5 3
| X | 2 | -2 | ............ | ........... |
| Y | ................... | ............... | -5 | 3 |
Answer
576k+ views
Hint: Here in this question first we need to find the value of X and Y by using the graph equation. Substituting the known values to the equation we can find the value unknown of the equation. Hence we can plot the graph by using the values.
Complete step-by-step answer:
In the question they have given a table which contains the values of X and Y. The equation of a graph is given as $ y = 2x + 1 $ .
Now we consider the value of X and we substitute in the equation of graph $ y = 2x + 1 $ , hence we can find the value of Y
Consider the equation of graph $ y = 2x + 1 $ ------ (1)
Substitute the value of X as 2 in equation (1). So we have
$
\Rightarrow y = 2(2) + 1 \\
\Rightarrow y = 4 + 1 \\
\Rightarrow y = 5 \;
$
When X is 2 the value of Y is 5
Substitute the value of X as -2 in equation (1). So we have
$
\Rightarrow y = 2( - 2) + 1 \\
\Rightarrow y = - 4 + 1 \\
\Rightarrow y = - 3 \;
$
When X is -2 the value of Y is -3
Now in the question they have given the value of Y. Therefore
Substitute the value of Y as -5 in equation (1). So we have
$
\Rightarrow - 5 = 2x + 1 \\
\Rightarrow - 5 - 1 = 2x \\
\Rightarrow - 6 = 2x \\
\Rightarrow x = \dfrac{{ - 6}}{2} \\
\Rightarrow x = - 3 \;
$
When Y is -5 the value of X is -3
Substitute the value of Y as 3 in equation (1). So we have
$
\Rightarrow 3 = 2x + 1 \\
\Rightarrow 3 - 1 = 2x \\
\Rightarrow 2 = 2x \\
\Rightarrow x = \dfrac{2}{2} \\
\Rightarrow x = 1 \;
$
When Y is 3 the value of X is 1.
Therefore we have table as
Considering these points we can plot the graph. The graph is shown below.
Note: The graph is plotted against the two axes namely X-axis and Y-axis. If we know the value of the one we can find the other by using the equation of the graph. This graph is two dimensional because they have mentioned only two axes.
Complete step-by-step answer:
In the question they have given a table which contains the values of X and Y. The equation of a graph is given as $ y = 2x + 1 $ .
Now we consider the value of X and we substitute in the equation of graph $ y = 2x + 1 $ , hence we can find the value of Y
Consider the equation of graph $ y = 2x + 1 $ ------ (1)
Substitute the value of X as 2 in equation (1). So we have
$
\Rightarrow y = 2(2) + 1 \\
\Rightarrow y = 4 + 1 \\
\Rightarrow y = 5 \;
$
When X is 2 the value of Y is 5
Substitute the value of X as -2 in equation (1). So we have
$
\Rightarrow y = 2( - 2) + 1 \\
\Rightarrow y = - 4 + 1 \\
\Rightarrow y = - 3 \;
$
When X is -2 the value of Y is -3
Now in the question they have given the value of Y. Therefore
Substitute the value of Y as -5 in equation (1). So we have
$
\Rightarrow - 5 = 2x + 1 \\
\Rightarrow - 5 - 1 = 2x \\
\Rightarrow - 6 = 2x \\
\Rightarrow x = \dfrac{{ - 6}}{2} \\
\Rightarrow x = - 3 \;
$
When Y is -5 the value of X is -3
Substitute the value of Y as 3 in equation (1). So we have
$
\Rightarrow 3 = 2x + 1 \\
\Rightarrow 3 - 1 = 2x \\
\Rightarrow 2 = 2x \\
\Rightarrow x = \dfrac{2}{2} \\
\Rightarrow x = 1 \;
$
When Y is 3 the value of X is 1.
Therefore we have table as
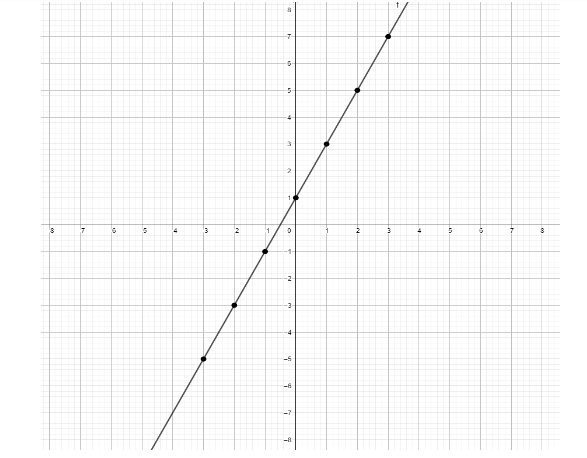
| X | 2 | -2 | -3 | 1 |
| Y | 5 | -3 | -5 | 3 |
Considering these points we can plot the graph. The graph is shown below.
Note: The graph is plotted against the two axes namely X-axis and Y-axis. If we know the value of the one we can find the other by using the equation of the graph. This graph is two dimensional because they have mentioned only two axes.
Recently Updated Pages
Basicity of sulphurous acid and sulphuric acid are
Master Class 8 Social Science: Engaging Questions & Answers for Success
Master Class 8 Science: Engaging Questions & Answers for Success
Master Class 8 Maths: Engaging Questions & Answers for Success
Class 8 Question and Answer - Your Ultimate Solutions Guide
Master Class 11 Business Studies: Engaging Questions & Answers for Success
Trending doubts
What are the 12 elements of nature class 8 chemistry CBSE
In Indian rupees 1 trillion is equal to how many c class 8 maths CBSE
Who created the image of Bharat Mata for the first class 8 social science CBSE
What is the Balkan issue in brief class 8 social science CBSE
Describe the elements of Belgian model for accommodating class 8 social science CBSE
Explain land use pattern in India and why has the land class 8 social science CBSE