


How do you compare two box and whisker plots?
Answer
555k+ views
Hint: When comparing box and whisker plots, the first thing is that they must represent the statistics of the same type of data. Secondly, actual comparison is made mainly between the minimum, the maximum, and the second quartile which is the median of the set of data. Lastly, every such plot has a number line below it which represents actual data.
Complete step by step solution:
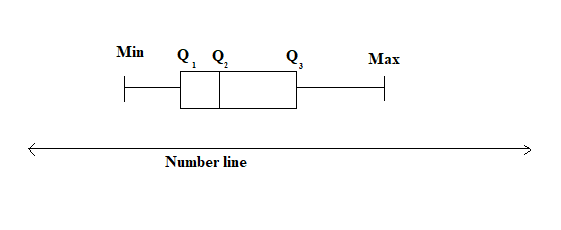
This is a box and whisker plot. It is divided into 25 percent sections divided between each of the quartiles or in maximum or minimum data. In the figure above, Min represents minimum data, Max represents maximum data and ${Q_1},\,{Q_2}\, and\,{Q_3}$ are the first second, and the third quartile respectively
When working with it, one needs to remember the following things.
When comparing box and whisker plots, the first thing is that they must represent the statistics of the same type of data.
This means you can’t compare the height of the class with the weather of a city or with the temperature variation of a chemical experiment.
Actual comparison is made mainly between the minimum, the maximum, and the second quartile which is the median of the set of data.
This means generally the first and the third quartile which are the medians of the minimum and the second quartile and the maximum and the second quartile respectively have little use at your level other than in forming the box.
For doing the actual comparison, we look below the lines on the plot and then compare the data on the number lines of the two plots.
Note:
If possible, avoid box and whisker plots and solve by median methods to get solutions with more speed. Also, when drawing the number line, keep in mind what data you have to represent and the range of the data flow and as such, adjust the divisions on the number line accordingly.
Complete step by step solution:
This is a box and whisker plot. It is divided into 25 percent sections divided between each of the quartiles or in maximum or minimum data. In the figure above, Min represents minimum data, Max represents maximum data and ${Q_1},\,{Q_2}\, and\,{Q_3}$ are the first second, and the third quartile respectively
When working with it, one needs to remember the following things.
When comparing box and whisker plots, the first thing is that they must represent the statistics of the same type of data.
This means you can’t compare the height of the class with the weather of a city or with the temperature variation of a chemical experiment.
Actual comparison is made mainly between the minimum, the maximum, and the second quartile which is the median of the set of data.
This means generally the first and the third quartile which are the medians of the minimum and the second quartile and the maximum and the second quartile respectively have little use at your level other than in forming the box.
For doing the actual comparison, we look below the lines on the plot and then compare the data on the number lines of the two plots.
Note:
If possible, avoid box and whisker plots and solve by median methods to get solutions with more speed. Also, when drawing the number line, keep in mind what data you have to represent and the range of the data flow and as such, adjust the divisions on the number line accordingly.
Recently Updated Pages
Master Class 11 Computer Science: Engaging Questions & Answers for Success
Master Class 11 Business Studies: Engaging Questions & Answers for Success
Master Class 11 Economics: Engaging Questions & Answers for Success
Master Class 11 English: Engaging Questions & Answers for Success
Master Class 11 Maths: Engaging Questions & Answers for Success
Master Class 11 Biology: Engaging Questions & Answers for Success
Trending doubts
One Metric ton is equal to kg A 10000 B 1000 C 100 class 11 physics CBSE
There are 720 permutations of the digits 1 2 3 4 5 class 11 maths CBSE
Discuss the various forms of bacteria class 11 biology CBSE
Draw a diagram of a plant cell and label at least eight class 11 biology CBSE
State the laws of reflection of light
Explain zero factorial class 11 maths CBSE