


Classes and frequency are given as follows
Classes Frequency $600 - 640$ $16$ $640 - 680$ $45$ $680 - 720$ $156$ $720 - 760$ $284$ $760 - 800$ $172$ $800 - 840$ $59$ $840 - 880$ $18$
Prepare a cumulative frequency table by less than method and draw an ogive.
| Classes | Frequency |
| $600 - 640$ | $16$ |
| $640 - 680$ | $45$ |
| $680 - 720$ | $156$ |
| $720 - 760$ | $284$ |
| $760 - 800$ | $172$ |
| $800 - 840$ | $59$ |
| $840 - 880$ | $18$ |
Answer
576k+ views
Hint: We will make a cumulative frequency table by less than type. Thereafter, we will take the upper limit and cumulative frequency and plot these points on a graph to get less than ogive.
Complete step-by-step answer:
We will draw a cumulative frequency distribution table by less than method.
Cumulative frequency: Cumulative frequency distribution is the sum of the class and all classes below it in a frequency distribution. It means that you are adding up a value and all the values that came before it in less than type method, we will take upper limit
Now, we will convert it by less type method.
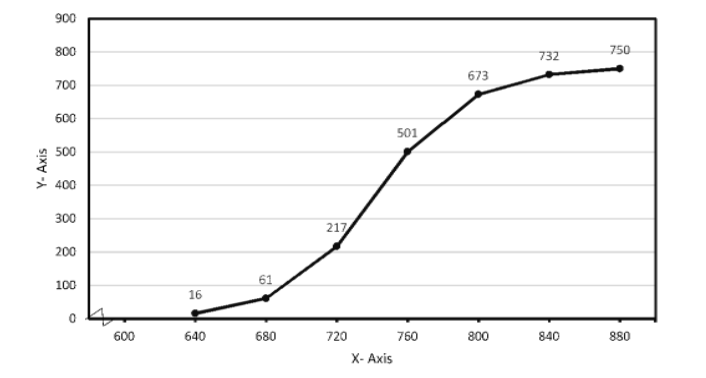
Now, plot the points $(640,16),(680,61),(720,217),(760,501),(800,673),(840,732),(880,750)$.Take upper class limit of class interval on x-axis and their respective frequency on y-axis, ogive can be drawn as follows
Note: In statistics, an ogive, also known as a cumulative frequency polygon, can refer to one of two things: any hand drawn graphic of a cumulative distribution function. any empirical cumulative distribution function.
Complete step-by-step answer:
We will draw a cumulative frequency distribution table by less than method.
Cumulative frequency: Cumulative frequency distribution is the sum of the class and all classes below it in a frequency distribution. It means that you are adding up a value and all the values that came before it in less than type method, we will take upper limit
| Classes | Frequency |
| $600 - 640$ | $16$ |
| $640 - 680$ | $45$ |
| $680 - 720$ | $156$ |
| $720 - 760$ | $284$ |
| $760 - 800$ | $172$ |
| $800 - 840$ | $59$ |
| $840 - 880$ | $18$ |
Now, we will convert it by less type method.
| Classes | Frequency | Cumulative frequency |
| Less than $640$ | $16$ | $16$ |
| Less than $680$ | $45$ | $16 + 45 = 61$ |
| Less than $720$ | $156$ | $61 + 156 = 217$ |
| Less than $760$ | $284$ | $217 + 284 = 501$ |
| Less than $800$ | $172$ | $501 + 172 = 673$ |
| Less than $840$ | $59$ | $673 + 59 = 732$ |
| Less than $880$ | $18$ | $732 + 18 = 750$ |
| $\sum {f = 750} $ |
Now, plot the points $(640,16),(680,61),(720,217),(760,501),(800,673),(840,732),(880,750)$.Take upper class limit of class interval on x-axis and their respective frequency on y-axis, ogive can be drawn as follows
Note: In statistics, an ogive, also known as a cumulative frequency polygon, can refer to one of two things: any hand drawn graphic of a cumulative distribution function. any empirical cumulative distribution function.
Recently Updated Pages
Master Class 9 General Knowledge: Engaging Questions & Answers for Success
Master Class 9 Social Science: Engaging Questions & Answers for Success
Master Class 9 English: Engaging Questions & Answers for Success
Master Class 9 Maths: Engaging Questions & Answers for Success
Master Class 9 Science: Engaging Questions & Answers for Success
Class 9 Question and Answer - Your Ultimate Solutions Guide
Trending doubts
Difference Between Plant Cell and Animal Cell
Fill the blanks with the suitable prepositions 1 The class 9 english CBSE
Who is eligible for RTE class 9 social science CBSE
Which places in India experience sunrise first and class 9 social science CBSE
What is pollution? How many types of pollution? Define it
Name 10 Living and Non living things class 9 biology CBSE