


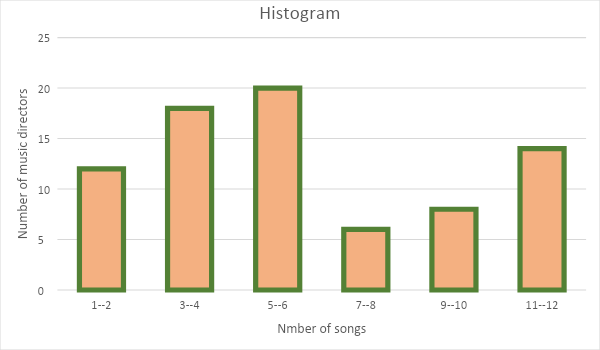
Calculate the number of songs made during the interval \[9 - 10\].
A.14
B.6
C.8
D.10
Answer
578.7k+ views
Hint: To find the value on y-axis corresponding to a value on x-axis, we can easily use a scale at the top of a bar diagram and find out. Here, however, the markings on y-axis are with a difference of 5, so we will have to find the approximate value of the number of songs.
Complete step-by-step answer:
From the given histogram we will have to find the number of songs made during interval \[9 - 10\]. To do this, we will try to find the approximate value on y-axis by eliminating other options.
If we observe the tip of the bar on \[9 - 10\] interval, we will notice that it lies between the numbers 5 and 10 and also it is not touching either of them. So the number of songs must be in between 5 and 10 except the extremities. This eliminates the options (A) and option (D).
Now, for option (B), if we notice the previous interval that is \[7 - 8\], we can easily see that it is just above the value of 5. So, it most likely has to be 6. This leaves us with only one option that is option (C) which is 8.
Option (C) actually seems true because the gap between the peak of bar and 10 on y-axis is more than the difference between peak of bar for interval \[7 - 8\] and 5 on y-axis. So, the number of songs for interval \[9 - 10\] will be 8.
Hence, option (C) will be the correct option.
Note: Another way of solving this could be using ruler on paper. Where we can find the average distance for 1 song on the y-axis and then find the length of the bar for interval \[9 - 10\] and easily divide this distance with the distance for 1 song to get the exact number of songs for the interval.
Recently Updated Pages
Master Class 10 Computer Science: Engaging Questions & Answers for Success
Master Class 10 General Knowledge: Engaging Questions & Answers for Success
Master Class 10 English: Engaging Questions & Answers for Success
Master Class 10 Social Science: Engaging Questions & Answers for Success
Master Class 10 Maths: Engaging Questions & Answers for Success
Master Class 10 Science: Engaging Questions & Answers for Success
Trending doubts
What is the median of the first 10 natural numbers class 10 maths CBSE
Which women's tennis player has 24 Grand Slam singles titles?
Who is the Brand Ambassador of Incredible India?
Why is there a time difference of about 5 hours between class 10 social science CBSE
Write a letter to the principal requesting him to grant class 10 english CBSE
A moving boat is observed from the top of a 150 m high class 10 maths CBSE