


By taking classes $30-40$,$40-50$,$50-60$,…, construct a frequency table for the following data:
$\begin{align}
& 65,34,74,49,52,35, \\
& 71,55,61,40,56,38, \\
& 52,56,52,33,60,35, \\
& 49,37,53,50,44,30, \\
& 62,50,47,45,47,50, \\
& 63,61,54,58,47,64, \\
& 37,38,44,42,47,55, \\
& 70,33,75,49,47,30, \\
& 60,69 \\
\end{align}$
Also, construct a combined histogram and frequency polygon for the distribution.
Answer
592.5k+ views
Hint: We will first arrange the given number in ascending or descending order. From the arrangement identify the maximum and minimum number in the arrangement and classify the classes according to given data. Now it is easier to calculate the frequency of classes and then we will construct a frequency table. Now we will construct a histogram using the ranges of classes and frequency of classes and for the frequency polygon we will take the middle value of class as $x$ coordinate and the frequency related to that class is taken as $y$ coordinate. Now from the coordinates we will construct the polygon.
Complete step-by-step answer:
Given that, the numbers are
$\begin{align}
& 65,34,74,49,52,35, \\
& 71,55,61,40,56,38, \\
& 52,56,52,33,60,35, \\
& 49,37,53,50,44,30, \\
& 62,50,47,45,47,50, \\
& 63,61,54,58,47,64, \\
& 37,38,44,42,47,55, \\
& 70,33,75,49,47,30, \\
& 60,69 \\
\end{align}$
Now the ascending order for the given numbers is
\[\begin{align}
& \text{30,30,33,33,34,35,35,37,37,38,38,} \\
& \text{40,42,44,44,45,47,47,47,47,47,49,49,49,} \\
& \text{50,50,50,52,52,52,53,54,55,55,56,56,58} \\
& \text{60,60,61,61,62,63,64,65,69,} \\
& \text{70,71,74,75} \\
\end{align}\]
Here the minimum value is $30$ and maximum value of $75$.
In the given data they mentioned to take the classes as $30-40$,$40-50$,$50-60$, then the classes are $30-40,40-50,50-60,60-70,70-80$
Now calculate the number of items in the given range and mark them as frequency as shown in below
The above table is the required frequency table.
For drawing a histogram, we are taking the classes in the frequency table on the $x-axis$ and frequency on $y-axis$ as shown in below.
For creating the frequency polygon we are going to use the Mid points of the classes as $x$ coordinates and the frequency of corresponding class is taken as $y$ coordinate and we will mark the points on the graph and then we will join them to get the polygon as shown in below
Note: Please arrange the given numbers in ascending or descending order to solve the problem easily. While arranging the numbers it is better to arrange in a way that we can simply differentiate them according to given classes.
Complete step-by-step answer:
Given that, the numbers are
$\begin{align}
& 65,34,74,49,52,35, \\
& 71,55,61,40,56,38, \\
& 52,56,52,33,60,35, \\
& 49,37,53,50,44,30, \\
& 62,50,47,45,47,50, \\
& 63,61,54,58,47,64, \\
& 37,38,44,42,47,55, \\
& 70,33,75,49,47,30, \\
& 60,69 \\
\end{align}$
Now the ascending order for the given numbers is
\[\begin{align}
& \text{30,30,33,33,34,35,35,37,37,38,38,} \\
& \text{40,42,44,44,45,47,47,47,47,47,49,49,49,} \\
& \text{50,50,50,52,52,52,53,54,55,55,56,56,58} \\
& \text{60,60,61,61,62,63,64,65,69,} \\
& \text{70,71,74,75} \\
\end{align}\]
Here the minimum value is $30$ and maximum value of $75$.
In the given data they mentioned to take the classes as $30-40$,$40-50$,$50-60$, then the classes are $30-40,40-50,50-60,60-70,70-80$
Now calculate the number of items in the given range and mark them as frequency as shown in below
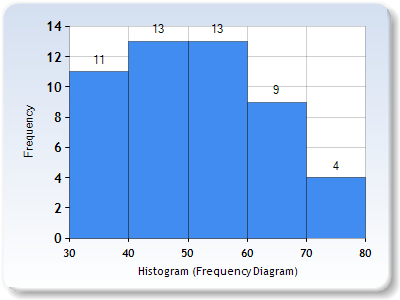
| Class | Frequency |
| $30-40$ | $11$ |
| $40-50$ | $13$ |
| $50-60$ | $13$ |
| $60-70$ | $9$ |
| $70-80$ | $4$ |
The above table is the required frequency table.
For drawing a histogram, we are taking the classes in the frequency table on the $x-axis$ and frequency on $y-axis$ as shown in below.
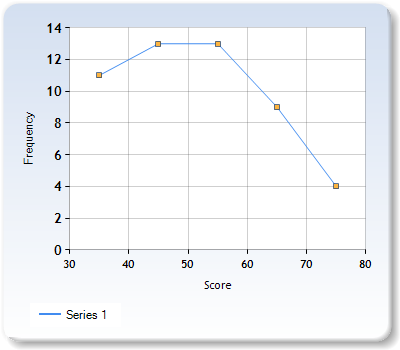
For creating the frequency polygon we are going to use the Mid points of the classes as $x$ coordinates and the frequency of corresponding class is taken as $y$ coordinate and we will mark the points on the graph and then we will join them to get the polygon as shown in below
Note: Please arrange the given numbers in ascending or descending order to solve the problem easily. While arranging the numbers it is better to arrange in a way that we can simply differentiate them according to given classes.
Recently Updated Pages
Basicity of sulphurous acid and sulphuric acid are
Master Class 11 Business Studies: Engaging Questions & Answers for Success
Master Class 11 Computer Science: Engaging Questions & Answers for Success
Master Class 11 Economics: Engaging Questions & Answers for Success
Master Class 11 Social Science: Engaging Questions & Answers for Success
Master Class 11 English: Engaging Questions & Answers for Success
Trending doubts
One Metric ton is equal to kg A 10000 B 1000 C 100 class 11 physics CBSE
The largest wind power cluster is located in the state class 11 social science CBSE
Explain zero factorial class 11 maths CBSE
State and prove Bernoullis theorem class 11 physics CBSE
Which among the following are examples of coming together class 11 social science CBSE
Can anyone list 10 advantages and disadvantages of friction