


What is box and whisker plot, and how would you display data on it?
Answer
559.8k+ views
Hint: Box and whisker plot is also known as box plot. This plot is a way to abstract a set of data that is estimated using an interval scale. The box plot will have five-number summary of a set of data, which is given by Minimum, ${{Q}_{1}}$ , Median, ${{Q}_{3}}$ , Maximum. ${{Q}_{1}}$ is the first quartile which is the value below the lower 25% of data contained and is placed at the left side in between the minimum value and median. Median is the centre of the box and the centre value of the dataset. ${{Q}_{3}}$ is the third quartile which is the value above the lower 25% of data contained. We have to draw boxes using these five-number summaries.
Complete step-by-step solution:
Let us see what a box and whisker plot is. Box and whisker plot is also known as box plot. This plot is a way to abstract a set of data that is estimated using an interval scale. Using this plot, we can read the data effectively and easily. All the data from multiple sources are summarized and displayed in a single graph. We will use this plot when we have multiple datasets from different sources which are related to each other. For example, we can use box plot if we have exam scores of different classes.
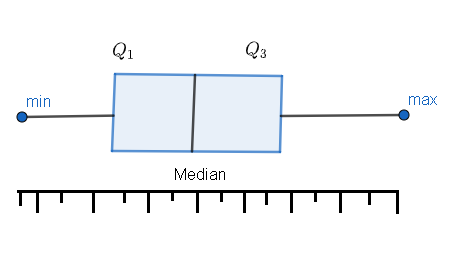
Now, let us see how a box plot is drawn. The box plot will have a five-number summary of a set of data. Let us list these five-number.
(i) The first one is the minimum value in the dataset. We have to display this number at the far left end.
(ii) The second one is the first quartile which is denoted as ${{Q}_{1}}$ . This is placed at the left side in between the minimum value and median. ${{Q}_{1}}$ is the value below the lower 25% of data contained.
(iii) The median value is the third one. We will illustrate this by a line that is drawn in the centre of the box.
(iv) The next one is the third quartile which is denoted as ${{Q}_{3}}$ . We will place this quartile at the right side in between the median and the maximum value. ${{Q}_{3}}$ is the value above the lower 25% of data contained.
(v) The last one is the maximum value in the dataset. We will illustrate this value at the far right end.
The box plot is shown below.
Let us consider a dataset {3, 7, 8, 5, 12, 14, 21, 13, 18}. We have to arrange the data in increasing order. We will get
3, 5, 7, 8, 12, 13, 14, 18, 21
Now, we have to find the range by subtracting minimum value from the maximum value.
\[\begin{align}
& \Rightarrow \text{Range }=\text{ Maximum value - Minimum value} \\
& \Rightarrow \text{Range }=\text{ }21-3=18 \\
\end{align}\]
Now, we have to find the median which is the centre value of the given data.
$\Rightarrow \text{Median}=12$
Now, let us find ${{Q}_{1}}$ . First quartile is the median of data values present at the left side of the median. Therefore, we have to find the median of 3,5,7,8.
$\begin{align}
& \Rightarrow {{Q}_{1}}=\text{Median}\left( 3,5,7,8 \right) \\
& \Rightarrow {{Q}_{1}}=\dfrac{5+7}{2}=\dfrac{12}{2}=6 \\
\end{align}$
Now, let us find ${{Q}_{3}}$ . First quartile is the median of data values present at the right side of the median. Therefore, we have to find the median of 13, 14, 18, 21.
$\begin{align}
& \Rightarrow {{Q}_{3}}=\text{Median}\left( 13,14,18,21 \right) \\
& \Rightarrow {{Q}_{3}}=\dfrac{14+18}{2}=\dfrac{32}{2}=16 \\
\end{align}$
Now, we have to find the interquartile range by subtracting ${{Q}_{1}}$ from ${{Q}_{3}}$ .
\[\Rightarrow \text{Interquartile range}={{Q}_{3}}{{Q}_{1}}~=166=10\]
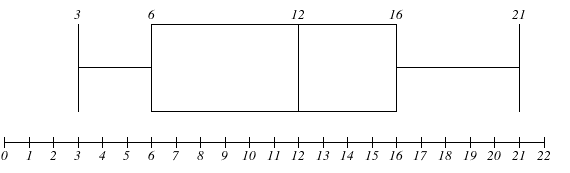
We know that the five-number summary is given by Minimum, ${{Q}_{1}}$ , Median, ${{Q}_{3}}$ , Maximum. That is, 3, 6, 12, 16, 21.
Hence, the box plot is drawn as follows.
Note: The advantages of the box and whisker plot is that it provides the skewness and symmetry of data. We can easily identify the data location and data spread. Box plot shows the data outliers.
Complete step-by-step solution:
Let us see what a box and whisker plot is. Box and whisker plot is also known as box plot. This plot is a way to abstract a set of data that is estimated using an interval scale. Using this plot, we can read the data effectively and easily. All the data from multiple sources are summarized and displayed in a single graph. We will use this plot when we have multiple datasets from different sources which are related to each other. For example, we can use box plot if we have exam scores of different classes.
Now, let us see how a box plot is drawn. The box plot will have a five-number summary of a set of data. Let us list these five-number.
(i) The first one is the minimum value in the dataset. We have to display this number at the far left end.
(ii) The second one is the first quartile which is denoted as ${{Q}_{1}}$ . This is placed at the left side in between the minimum value and median. ${{Q}_{1}}$ is the value below the lower 25% of data contained.
(iii) The median value is the third one. We will illustrate this by a line that is drawn in the centre of the box.
(iv) The next one is the third quartile which is denoted as ${{Q}_{3}}$ . We will place this quartile at the right side in between the median and the maximum value. ${{Q}_{3}}$ is the value above the lower 25% of data contained.
(v) The last one is the maximum value in the dataset. We will illustrate this value at the far right end.
The box plot is shown below.
Let us consider a dataset {3, 7, 8, 5, 12, 14, 21, 13, 18}. We have to arrange the data in increasing order. We will get
3, 5, 7, 8, 12, 13, 14, 18, 21
Now, we have to find the range by subtracting minimum value from the maximum value.
\[\begin{align}
& \Rightarrow \text{Range }=\text{ Maximum value - Minimum value} \\
& \Rightarrow \text{Range }=\text{ }21-3=18 \\
\end{align}\]
Now, we have to find the median which is the centre value of the given data.
$\Rightarrow \text{Median}=12$
Now, let us find ${{Q}_{1}}$ . First quartile is the median of data values present at the left side of the median. Therefore, we have to find the median of 3,5,7,8.
$\begin{align}
& \Rightarrow {{Q}_{1}}=\text{Median}\left( 3,5,7,8 \right) \\
& \Rightarrow {{Q}_{1}}=\dfrac{5+7}{2}=\dfrac{12}{2}=6 \\
\end{align}$
Now, let us find ${{Q}_{3}}$ . First quartile is the median of data values present at the right side of the median. Therefore, we have to find the median of 13, 14, 18, 21.
$\begin{align}
& \Rightarrow {{Q}_{3}}=\text{Median}\left( 13,14,18,21 \right) \\
& \Rightarrow {{Q}_{3}}=\dfrac{14+18}{2}=\dfrac{32}{2}=16 \\
\end{align}$
Now, we have to find the interquartile range by subtracting ${{Q}_{1}}$ from ${{Q}_{3}}$ .
\[\Rightarrow \text{Interquartile range}={{Q}_{3}}{{Q}_{1}}~=166=10\]
We know that the five-number summary is given by Minimum, ${{Q}_{1}}$ , Median, ${{Q}_{3}}$ , Maximum. That is, 3, 6, 12, 16, 21.
Hence, the box plot is drawn as follows.
Note: The advantages of the box and whisker plot is that it provides the skewness and symmetry of data. We can easily identify the data location and data spread. Box plot shows the data outliers.
Recently Updated Pages
Master Class 9 General Knowledge: Engaging Questions & Answers for Success
Master Class 9 Maths: Engaging Questions & Answers for Success
Master Class 9 Science: Engaging Questions & Answers for Success
Master Class 9 English: Engaging Questions & Answers for Success
Master Class 9 Social Science: Engaging Questions & Answers for Success
Class 9 Question and Answer - Your Ultimate Solutions Guide
Trending doubts
Explain the Treaty of Vienna of 1815 class 10 social science CBSE
Who Won 36 Oscar Awards? Record Holder Revealed
What is the median of the first 10 natural numbers class 10 maths CBSE
Why is it 530 pm in india when it is 1200 afternoon class 10 social science CBSE
Make a sketch of the human nerve cell What function class 10 biology CBSE
Define Potential, Developed, Stock and Reserved resources