


At what time would the car be farthest from its original starting position?
$\begin{align}
& \text{A}\text{. }2\text{ seconds} \\
& \text{B}\text{. 4 seconds} \\
& \text{C}\text{. 6 seconds} \\
& \text{D}\text{. 8 seconds} \\
\end{align}$
Answer
630k+ views
- Hint: Acceleration versus time graph gives the value of acceleration of body at a particular moment and the trend in variation of velocity of the body over a period of time. The area under the acceleration-time graph in a time frame gives the change in velocity of the body in that particular time interval.
Complete step-by-step solution
Acceleration versus time graphs tells us about the velocity of a body the same way velocity versus time graphs tell us about the displacement of the body. The change in velocity in a given time frame, or interval, is equal to the area under the acceleration-time graph during the same time interval.
Explanation of an Acceleration-Time Graph:
The vertical axis in the acceleration-time graph represents the acceleration of the body. The reading of the value of the graph at a particular time will fetch us the acceleration of the body in meters per second squared for that particular moment of time.
The slope of the acceleration-time graph represents a quantity known as jerk. Jerk is defined as the rate of change of acceleration of a body.
The area under the acceleration-time graph represents the change in velocity. Or, we can say that the area under the acceleration-time graph for a certain interval of time is equal to the change in velocity of the body during that time interval.
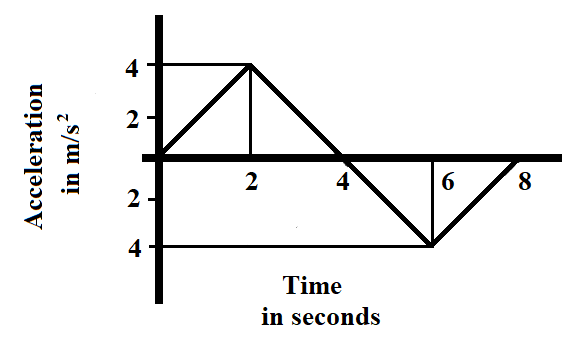
We are given an acceleration-time graph of a car,
The area under the curve represents the change in velocity. The car begins from the position of rest with an increasing positive velocity. After 4 seconds, the car begins to slow and the area under the curve from 4 to 8 seconds counters the increase in velocity from 0 to 4 seconds, bringing the car to rest.
The car does not change its direction during the whole motion and was moving away from the original starting point.
Therefore,
$t=8\text{ seconds}$
The car would be the farthest from the original starting position at 8 seconds.
Hence, the correct option is D.
Note: In an acceleration-time graph, the slope of the graph represents a quantity known as jerk. Jerk is described as the rate of change of velocity of a body, while the under the curve of acceleration-time graph gives the change in velocity of the body. It should be noted that the area does not give the velocity of the body at a particular moment but the change in velocity over a time interval.
Complete step-by-step solution
Acceleration versus time graphs tells us about the velocity of a body the same way velocity versus time graphs tell us about the displacement of the body. The change in velocity in a given time frame, or interval, is equal to the area under the acceleration-time graph during the same time interval.
Explanation of an Acceleration-Time Graph:
The vertical axis in the acceleration-time graph represents the acceleration of the body. The reading of the value of the graph at a particular time will fetch us the acceleration of the body in meters per second squared for that particular moment of time.
The slope of the acceleration-time graph represents a quantity known as jerk. Jerk is defined as the rate of change of acceleration of a body.
The area under the acceleration-time graph represents the change in velocity. Or, we can say that the area under the acceleration-time graph for a certain interval of time is equal to the change in velocity of the body during that time interval.
We are given an acceleration-time graph of a car,
The area under the curve represents the change in velocity. The car begins from the position of rest with an increasing positive velocity. After 4 seconds, the car begins to slow and the area under the curve from 4 to 8 seconds counters the increase in velocity from 0 to 4 seconds, bringing the car to rest.
The car does not change its direction during the whole motion and was moving away from the original starting point.
Therefore,
$t=8\text{ seconds}$
The car would be the farthest from the original starting position at 8 seconds.
Hence, the correct option is D.
Note: In an acceleration-time graph, the slope of the graph represents a quantity known as jerk. Jerk is described as the rate of change of velocity of a body, while the under the curve of acceleration-time graph gives the change in velocity of the body. It should be noted that the area does not give the velocity of the body at a particular moment but the change in velocity over a time interval.
Recently Updated Pages
Master Class 11 English: Engaging Questions & Answers for Success
Master Class 11 Social Science: Engaging Questions & Answers for Success
Master Class 11 Maths: Engaging Questions & Answers for Success
Master Class 11 Biology: Engaging Questions & Answers for Success
Master Class 11 Physics: Engaging Questions & Answers for Success
Master Class 11 Chemistry: Engaging Questions & Answers for Success
Trending doubts
One Metric ton is equal to kg A 10000 B 1000 C 100 class 11 physics CBSE
Difference Between Prokaryotic Cells and Eukaryotic Cells
Find the value of the expression given below sin 30circ class 11 maths CBSE
Difference between physical and chemical change class 11 chemistry CBSE
Two of the body parts which do not appear in MRI are class 11 biology CBSE
Draw a diagram of a plant cell and label at least eight class 11 biology CBSE