


ASSERTION: The correlation between two variables “Intensity of cold” and “Sale of woollen clothes” is positive.
REASON: The angle between two regression lines is $\pi $.
${\text{(A)}}$ Both Assertion and Reason are correct and Reason is the correct explanation for Assertion.
${\text{(B)}}$ Both Assertion and Reason are correct but reason is not the correct explanation for assertion.
${\text{(C)}}$ Assertion is correct but Reason is incorrect.
${\text{(D)}}$ Both Assertion and Reason are incorrect.
Answer
612.3k+ views
Hint: The statistical association of linear relationship between two variables is known as Correlation. If the relationship between two variables moves in the same direction, it is said to be a positive correlation. (i.e) when a variable increases, the other variable increases too and vice versa.
Complete step-by-step solution:
A positive correlation graph can be plotted as follows.
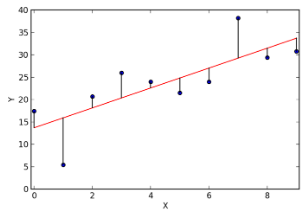
Here, when the “Intensity of cold” increases, the “Sale of woollen clothes” too increases.
Let the variable “Intensity of cold” be X & the other variable “Sale of woollen clothes” be Y. So, we will get a linear graph of which the correlation is positive.
Therefore, the Assertion is true.
REASON:
It is given, “The angle between two regression lines is $\pi $”.
For a positive correlation, the angle between two regression lines is always an acute angle. Since the angle lies between ${\text{0 to 9}}{{\text{0}}^ \circ }$ (i.e) ${\text{0 to }}\dfrac{{{\pi }}}{{\text{2}}}$, there is no way to be an obtuse angle. So, the angle $\pi $ is impossible.
Therefore, the Reason is incorrect.
Now, the Final answer is ${\text{(C)}}$ Assertion is true but Reason is incorrect.
Note: The solution can be found through logical reasoning itself, because it is a universal truth. When winter arrives, people prefer woollen clothes. So, there will be an increase in sales of woollen clothes. Obviously, it is a positive correlation.
And the angle of line regression is found by plotting the graph and using the formula $\tan \theta = \dfrac{{1 - {r^2}}}{r} \times \dfrac{{{\sigma _x}{\sigma _y}}}{{\sigma _x^2 + \sigma _y^2}}$. But, below is a simple strategy.
If the correlation between two variables is positive, then the angle between the two regression line is an acute angle (i.e.) ${\text{0 to }}\dfrac{{{\pi }}}{{\text{2}}}$
If the correlation between two variables is negative, then the angle between the two regression line is an obtuse angle (i.e.) \[\dfrac{{{\pi }}}{{\text{2}}}{{ {\text{to}} \pi }}\].
Complete step-by-step solution:
A positive correlation graph can be plotted as follows.
Here, when the “Intensity of cold” increases, the “Sale of woollen clothes” too increases.
Let the variable “Intensity of cold” be X & the other variable “Sale of woollen clothes” be Y. So, we will get a linear graph of which the correlation is positive.
Therefore, the Assertion is true.
REASON:
It is given, “The angle between two regression lines is $\pi $”.
For a positive correlation, the angle between two regression lines is always an acute angle. Since the angle lies between ${\text{0 to 9}}{{\text{0}}^ \circ }$ (i.e) ${\text{0 to }}\dfrac{{{\pi }}}{{\text{2}}}$, there is no way to be an obtuse angle. So, the angle $\pi $ is impossible.
Therefore, the Reason is incorrect.
Now, the Final answer is ${\text{(C)}}$ Assertion is true but Reason is incorrect.
Note: The solution can be found through logical reasoning itself, because it is a universal truth. When winter arrives, people prefer woollen clothes. So, there will be an increase in sales of woollen clothes. Obviously, it is a positive correlation.
And the angle of line regression is found by plotting the graph and using the formula $\tan \theta = \dfrac{{1 - {r^2}}}{r} \times \dfrac{{{\sigma _x}{\sigma _y}}}{{\sigma _x^2 + \sigma _y^2}}$. But, below is a simple strategy.
If the correlation between two variables is positive, then the angle between the two regression line is an acute angle (i.e.) ${\text{0 to }}\dfrac{{{\pi }}}{{\text{2}}}$
If the correlation between two variables is negative, then the angle between the two regression line is an obtuse angle (i.e.) \[\dfrac{{{\pi }}}{{\text{2}}}{{ {\text{to}} \pi }}\].
Recently Updated Pages
Master Class 11 English: Engaging Questions & Answers for Success
Master Class 11 Social Science: Engaging Questions & Answers for Success
Master Class 11 Maths: Engaging Questions & Answers for Success
Master Class 11 Biology: Engaging Questions & Answers for Success
Master Class 11 Physics: Engaging Questions & Answers for Success
Master Class 11 Chemistry: Engaging Questions & Answers for Success
Trending doubts
One Metric ton is equal to kg A 10000 B 1000 C 100 class 11 physics CBSE
Difference Between Prokaryotic Cells and Eukaryotic Cells
Find the value of the expression given below sin 30circ class 11 maths CBSE
Difference between physical and chemical change class 11 chemistry CBSE
Two of the body parts which do not appear in MRI are class 11 biology CBSE
Draw a diagram of a plant cell and label at least eight class 11 biology CBSE