


Answer in detail:
What is a pie-diagram? Construct a pie-diagram from the following data.
Sector $\% $ Contribution to GDP Primary 32 Secondary 28 Tertiary 40
| Sector | $\% $ Contribution to GDP |
| Primary | 32 |
| Secondary | 28 |
| Tertiary | 40 |
Answer
621.9k+ views
Hint: Here we have to know the pie diagram and construction of pie diagrams of given data.
First of all we have to find the central angle for any pie diagram related question.
For finding the central angle value, we initially find the value of the total component value.
Finally we construct a pie diagram.
Formula used: ${\text{Central angle of component = }}\dfrac{{{\text{value of the component}}}}{{{\text{Total Value}}}}{{ \times 36}}{{\text{0}}^ \circ }$
Complete step-by-step solution:
First we have to know definition of pie-diagram
A pie chart or pie diagram is a circular graph which is divided into slices to illustrate the numerical proportion.
Now we have to construct a pie diagram for the given data.
Steps of pie graph construction:
${\text{1}}{\text{.}}$ For construction of pie diagrams, first we have to calculate the central angle for each sector.
Central angle of circle:
The angle between two radii of a circle is known as the central angle of the circle.
Central angle of component ${\text{ = }}\dfrac{{{\text{value of the component}}}}{{{\text{Total Value}}}}{{ \times 36}}{{\text{0}}^ \circ }$
In each sector, the value of the component is given.
Now we have to find the total value of component
$ \Rightarrow {\text{ Total value of component = 32 + 28 + 40}}$
On adding this we get,
${\text{Total value = 100}}$
Now we have to find the central angle of each component.
The central angle of primary sector ${\text{ = }}\dfrac{{{\text{32}}}}{{{\text{100}}}}{{ \times 36}}{{\text{0}}^ \circ }$
Multiply the numerator value and then divided by $100$ we get,
The central angle of primary sector ${\text{ = 115}}{\text{.}}{{\text{2}}^ \circ }$
The central angle of secondary sector ${\text{ = }}\dfrac{{{\text{28}}}}{{{\text{100}}}}{{ \times 36}}{{\text{0}}^ \circ }$
Multiply the numerator value and then divided by $100$ we get,
The central angle of secondary sector ${\text{ = 100}}{\text{.}}{{\text{8}}^ \circ }$
Also, the central angle of tertiary sector ${\text{ = }}\dfrac{{{\text{40}}}}{{{\text{100}}}}{{ \times 36}}{{\text{0}}^ \circ }$
Multiply the numerator value and then divided by $100$ we get,
The central angle of tertiary \[{\text{ = 14}}{{\text{4}}^ \circ }\]
Hence step 1 process completed.
2. Draw a circle of convenient radius.
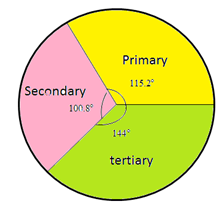
3. Draw sectors starting from the horizontal radius with central angle of ${\text{115}}{\text{.}}{{\text{2}}^ \circ }{\text{, 100}}{\text{.}}{{\text{8}}^ \circ }{\text{ and 14}}{{\text{4}}^ \circ }$ respectively.
4. Finally shade the sectors differently using different colors and label them.
Pie diagram:
Note: In a pie chart, the various observations or components are represented by the sectors of a circle.
Whole circle represents the sum of the values of all components.
The easiest way to check the answer is, we add the angles first.
If you get \[{360^ \circ }\] then the answer will be correct, otherwise you made a mistake.
Here we get the angles ${\text{115}}{\text{.}}{{\text{2}}^ \circ }{\text{,100}}{\text{.}}{{\text{8}}^ \circ }{\text{,14}}{{\text{4}}^ \circ }$.
On adding we get,
${\text{115}}{\text{.}}{{\text{2}}^ \circ }{\text{ + 100}}{\text{.}}{{\text{8}}^ \circ }{\text{ + 14}}{{\text{4}}^ \circ }{\text{ = 36}}{{\text{0}}^ \circ }$
Hence the answer is verified.
First of all we have to find the central angle for any pie diagram related question.
For finding the central angle value, we initially find the value of the total component value.
Finally we construct a pie diagram.
Formula used: ${\text{Central angle of component = }}\dfrac{{{\text{value of the component}}}}{{{\text{Total Value}}}}{{ \times 36}}{{\text{0}}^ \circ }$
Complete step-by-step solution:
First we have to know definition of pie-diagram
A pie chart or pie diagram is a circular graph which is divided into slices to illustrate the numerical proportion.
Now we have to construct a pie diagram for the given data.
Steps of pie graph construction:
${\text{1}}{\text{.}}$ For construction of pie diagrams, first we have to calculate the central angle for each sector.
Central angle of circle:
The angle between two radii of a circle is known as the central angle of the circle.
Central angle of component ${\text{ = }}\dfrac{{{\text{value of the component}}}}{{{\text{Total Value}}}}{{ \times 36}}{{\text{0}}^ \circ }$
In each sector, the value of the component is given.
Now we have to find the total value of component
$ \Rightarrow {\text{ Total value of component = 32 + 28 + 40}}$
On adding this we get,
${\text{Total value = 100}}$
Now we have to find the central angle of each component.
The central angle of primary sector ${\text{ = }}\dfrac{{{\text{32}}}}{{{\text{100}}}}{{ \times 36}}{{\text{0}}^ \circ }$
Multiply the numerator value and then divided by $100$ we get,
The central angle of primary sector ${\text{ = 115}}{\text{.}}{{\text{2}}^ \circ }$
The central angle of secondary sector ${\text{ = }}\dfrac{{{\text{28}}}}{{{\text{100}}}}{{ \times 36}}{{\text{0}}^ \circ }$
Multiply the numerator value and then divided by $100$ we get,
The central angle of secondary sector ${\text{ = 100}}{\text{.}}{{\text{8}}^ \circ }$
Also, the central angle of tertiary sector ${\text{ = }}\dfrac{{{\text{40}}}}{{{\text{100}}}}{{ \times 36}}{{\text{0}}^ \circ }$
Multiply the numerator value and then divided by $100$ we get,
The central angle of tertiary \[{\text{ = 14}}{{\text{4}}^ \circ }\]
Hence step 1 process completed.
2. Draw a circle of convenient radius.
3. Draw sectors starting from the horizontal radius with central angle of ${\text{115}}{\text{.}}{{\text{2}}^ \circ }{\text{, 100}}{\text{.}}{{\text{8}}^ \circ }{\text{ and 14}}{{\text{4}}^ \circ }$ respectively.
4. Finally shade the sectors differently using different colors and label them.
Pie diagram:
Note: In a pie chart, the various observations or components are represented by the sectors of a circle.
Whole circle represents the sum of the values of all components.
The easiest way to check the answer is, we add the angles first.
If you get \[{360^ \circ }\] then the answer will be correct, otherwise you made a mistake.
Here we get the angles ${\text{115}}{\text{.}}{{\text{2}}^ \circ }{\text{,100}}{\text{.}}{{\text{8}}^ \circ }{\text{,14}}{{\text{4}}^ \circ }$.
On adding we get,
${\text{115}}{\text{.}}{{\text{2}}^ \circ }{\text{ + 100}}{\text{.}}{{\text{8}}^ \circ }{\text{ + 14}}{{\text{4}}^ \circ }{\text{ = 36}}{{\text{0}}^ \circ }$
Hence the answer is verified.
Recently Updated Pages
Basicity of sulphurous acid and sulphuric acid are
Master Class 11 English: Engaging Questions & Answers for Success
Master Class 11 Physics: Engaging Questions & Answers for Success
Master Class 11 Computer Science: Engaging Questions & Answers for Success
Master Class 11 Chemistry: Engaging Questions & Answers for Success
Master Class 11 Social Science: Engaging Questions & Answers for Success
Trending doubts
Difference Between Prokaryotic Cells and Eukaryotic Cells
Two of the body parts which do not appear in MRI are class 11 biology CBSE
One Metric ton is equal to kg A 10000 B 1000 C 100 class 11 physics CBSE
10 examples of friction in our daily life
Draw a diagram of nephron and explain its structur class 11 biology CBSE
What will happen if the mucus is not secreted by the class 11 biology CBSE