


An object is thrown vertically up. The velocity-time graph for motion of the particle will be
A.
B.
C.
D.
Answer
532.5k+ views
Hint: In order to draw the graph between velocity and time of an object when thrown vertically upward we need to understand the trajectory of particle from initial point of journey to the time till it falls back on ground, we will use sign convention and direction of velocity as primary parameter to draw the graph between velocity and time and keeping time as a linear unidirectional parameter on X axis and keeping velocity as a dependent variable on time.
Complete answer:
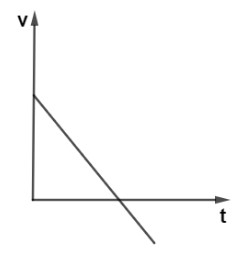
Suppose a body is thrown upward with some velocity now as soon as body is thrown it has some positive velocity which decreases as it continues to move upward and at maximum height velocity becomes zero.
(i) So, in the first half of the journey the object will have a positive velocity which goes on decreasing in the positive Y axis with increasing time on the X axis.Now, in the second half of the journey when the object will fall freely under the force of gravity, as soon as it starts to fall it will start with zero velocity and then continue to increase the magnitude of velocity but in negative direction with respect to the initial half journey.
(ii) So, in the second half of the journey, the object will increase from zero to its maximum value in the negative Y direction with increasing time on the X axis.
So, fulfilling these (i) and (ii) conditions, the best graph is drawn among given options is (B).

where at $t = 0$ object has maximum velocity which then continues to decrease in positive Y axis and then velocity becomes zero at some time, later velocity gets increased in negative Y axis on increasing time.
Hence, the correct option is B.
Note: It should be remembered that, the velocity at highest point became zero because body is moving against the force of gravity and due to symmetry of motion the final velocity of the body while hitting the ground will always be same the velocity at which it is thrown upwards, also the area under velocity time graph always represent the total distance covered by the body.
Complete answer:
Suppose a body is thrown upward with some velocity now as soon as body is thrown it has some positive velocity which decreases as it continues to move upward and at maximum height velocity becomes zero.
(i) So, in the first half of the journey the object will have a positive velocity which goes on decreasing in the positive Y axis with increasing time on the X axis.Now, in the second half of the journey when the object will fall freely under the force of gravity, as soon as it starts to fall it will start with zero velocity and then continue to increase the magnitude of velocity but in negative direction with respect to the initial half journey.
(ii) So, in the second half of the journey, the object will increase from zero to its maximum value in the negative Y direction with increasing time on the X axis.
So, fulfilling these (i) and (ii) conditions, the best graph is drawn among given options is (B).
where at $t = 0$ object has maximum velocity which then continues to decrease in positive Y axis and then velocity becomes zero at some time, later velocity gets increased in negative Y axis on increasing time.
Hence, the correct option is B.
Note: It should be remembered that, the velocity at highest point became zero because body is moving against the force of gravity and due to symmetry of motion the final velocity of the body while hitting the ground will always be same the velocity at which it is thrown upwards, also the area under velocity time graph always represent the total distance covered by the body.
Recently Updated Pages
Master Class 11 Social Science: Engaging Questions & Answers for Success
Master Class 11 English: Engaging Questions & Answers for Success
Master Class 11 Maths: Engaging Questions & Answers for Success
Master Class 11 Chemistry: Engaging Questions & Answers for Success
Master Class 11 Biology: Engaging Questions & Answers for Success
Master Class 11 Physics: Engaging Questions & Answers for Success
Trending doubts
One Metric ton is equal to kg A 10000 B 1000 C 100 class 11 physics CBSE
Difference Between Prokaryotic Cells and Eukaryotic Cells
How many of the following diseases can be studied with class 11 biology CBSE
Draw a diagram of a plant cell and label at least eight class 11 biology CBSE
Two of the body parts which do not appear in MRI are class 11 biology CBSE
Which gas is abundant in air class 11 chemistry CBSE