


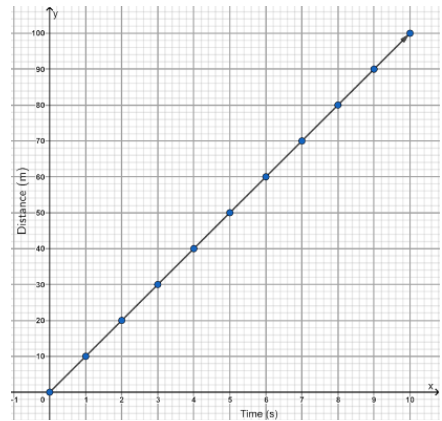
An object is moving along a straight line with a uniform speed of 10 m/s. Plot a graph showing distance versus time from t = 0 to t = 10 s.
Answer
600.6k+ views
Hint: To plot a graph of distance versus time, we need to calculate distance for t = 0 to t = 10 s. Distance is given by the formula:
\[d=s\times t\]
Where s is speed and t is time.
We will calculate distance for 10 different values of t and since speed is uniform, the value of speed will remain 10 m/s.
After calculating the values, we can plot a graph taking time on the x-axis and distance on y-axis.
Complete step by step answer:
For t = 0,
\[\begin{align}
& \text{ }d=s\times t \\
& \Rightarrow d=10\times 0 \\
& \Rightarrow d=0 \\
\end{align}\]
Therefore, when t = 0, d = 0.
For t = 1,
\[\begin{align}
& \text{ }d=s\times t \\
& \Rightarrow d=10\times 1 \\
& \therefore d=10\text{ m} \\
\end{align}\]
Therefore, when t = 1 s, d = 10 m.
For t = 2,
\[\begin{align}
& \text{ }d=s\times t \\
& \Rightarrow d=10\times 2 \\
& \therefore d=20\text{ m} \\
\end{align}\]
Therefore, when t = 2 s, d = 20 m.
For t = 3,
\[\begin{align}
& \text{ }d=s\times t \\
& \Rightarrow d=10\times 3 \\
& \therefore d=30\text{ m} \\
\end{align}\]
Therefore, when t = 3 s, d = 30 m.
For t = 4,
\[\begin{align}
& \text{ }d=s\times t \\
& \Rightarrow d=10\times 4 \\
& \therefore d=40\text{ m} \\
\end{align}\]
Therefore, when t = 4 s, d = 40 m.
For t = 5,
\[\begin{align}
& \text{ }d=s\times t \\
& \Rightarrow d=10\times 5 \\
& \Rightarrow d=50\text{ m} \\
\end{align}\]
Therefore, when t = 5 s, d = 50 m.
For t = 6,
\[\begin{align}
& \text{ }d=s\times t \\
& \Rightarrow d=10\times 6 \\
& \Rightarrow d=60\text{ m} \\
\end{align}\]
Therefore, when t = 6 s, d = 60 m.
For t = 7,
\[\begin{align}
& \text{ }d=s\times t \\
& \Rightarrow d=10\times 7 \\
& \Rightarrow d=70\text{ m} \\
\end{align}\]
Therefore, when t = 7 s, d = 70 m.
For t = 8,
\[\begin{align}
& \text{ }d=s\times t \\
& \Rightarrow d=10\times 8 \\
& \therefore d=80\text{ m} \\
\end{align}\]
Therefore, when t = 8 s, d = 80 m.
For t = 9,
\[\begin{align}
& \text{ }d=s\times t \\
& \Rightarrow d=10\times 9 \\
& \therefore d=90\text{ m} \\
\end{align}\]
Therefore, when t = 9 s, d = 90 m.
For t = 10,
\[\begin{align}
& \text{ }d=s\times t \\
& \Rightarrow d=10\times 10 \\
& \therefore d=100\text{ m} \\
\end{align}\]
Therefore, when t = 10 s, d = 100 m.
Taking time on x-axis and distance on y-axis, we can obtain a graph as follows:
Note:
In the formula for distance, that is \[d=s\times t\] distance and time are directly proportional values, that is as distance increases, time also increases and vice versa. This can be verified from the graph.
We can plot the graph by taking any number of values of t. The nature of the graph will not change.
Recently Updated Pages
Master Class 11 Social Science: Engaging Questions & Answers for Success
Master Class 11 English: Engaging Questions & Answers for Success
Master Class 11 Maths: Engaging Questions & Answers for Success
Master Class 11 Chemistry: Engaging Questions & Answers for Success
Master Class 11 Biology: Engaging Questions & Answers for Success
Master Class 11 Physics: Engaging Questions & Answers for Success
Trending doubts
One Metric ton is equal to kg A 10000 B 1000 C 100 class 11 physics CBSE
Difference Between Prokaryotic Cells and Eukaryotic Cells
How many of the following diseases can be studied with class 11 biology CBSE
Draw a diagram of a plant cell and label at least eight class 11 biology CBSE
Two of the body parts which do not appear in MRI are class 11 biology CBSE
Which gas is abundant in air class 11 chemistry CBSE