


Alexander Von Humbolt described for the first time
(a) Population growth equation
(b) Ecological biodiversity
(c) Laws of limiting factor
(d) Species area relationships
Answer
597k+ views
Hint: Alexander Von Humbolt observed that within a region species richness increased with increasing explored area, but only up to a limit.
Complete answer: The great German naturalist and Geographer Alexander Von Humbolt observed the species-area relationship when he was doing his research experiments in South American jungles.
Using the species-area relationship, we get a species-area curve that describes the relationship between the area of a habitat, or a part of the habitat and the number of species found within that area. Larger areas tend to contain larger numbers of species, and the relative numbers seem to follow systematic mathematical relationships.
On a logarithmic scale, the relationship is a straight line described by the equation:-
log S= log C + Z log A
where,
S=Species richness
A= Area
Z= Slope of the line
C= Y-intercept
It is observed that the value of Z lies in the range of 0.1 to 0.2, regardless of the taxonomic group or the region (whether it is in the plants in Britain, birds in California or mollusks in New York state, the slopes of the regression line are amazingly similar).
So, the correct answer is ‘species-area relationships’.
Note:
1. In the graph, the steeper slopes represent that the number of species found increases faster than the area explored in very large areas like the full area of a continent.
2. The mathematical functions used in this method were to characterize species-area relationships which often have different parameters when applied to data from different ranges of area. These differences in observed species-area functions are often attributed to sampling methodologies and underlying ecological and biogeographical processes.
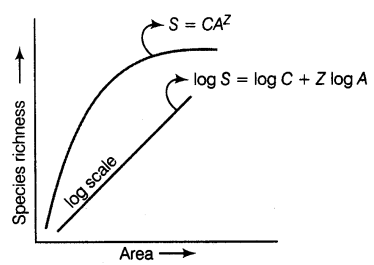
Fig. Species area curve
Complete answer: The great German naturalist and Geographer Alexander Von Humbolt observed the species-area relationship when he was doing his research experiments in South American jungles.
Using the species-area relationship, we get a species-area curve that describes the relationship between the area of a habitat, or a part of the habitat and the number of species found within that area. Larger areas tend to contain larger numbers of species, and the relative numbers seem to follow systematic mathematical relationships.
On a logarithmic scale, the relationship is a straight line described by the equation:-
log S= log C + Z log A
where,
S=Species richness
A= Area
Z= Slope of the line
C= Y-intercept
It is observed that the value of Z lies in the range of 0.1 to 0.2, regardless of the taxonomic group or the region (whether it is in the plants in Britain, birds in California or mollusks in New York state, the slopes of the regression line are amazingly similar).
So, the correct answer is ‘species-area relationships’.
Note:
1. In the graph, the steeper slopes represent that the number of species found increases faster than the area explored in very large areas like the full area of a continent.
2. The mathematical functions used in this method were to characterize species-area relationships which often have different parameters when applied to data from different ranges of area. These differences in observed species-area functions are often attributed to sampling methodologies and underlying ecological and biogeographical processes.
Fig. Species area curve
Recently Updated Pages
Master Class 10 Computer Science: Engaging Questions & Answers for Success
Master Class 10 General Knowledge: Engaging Questions & Answers for Success
Master Class 10 English: Engaging Questions & Answers for Success
Master Class 10 Social Science: Engaging Questions & Answers for Success
Master Class 10 Maths: Engaging Questions & Answers for Success
Master Class 10 Science: Engaging Questions & Answers for Success
Trending doubts
What is the median of the first 10 natural numbers class 10 maths CBSE
Which women's tennis player has 24 Grand Slam singles titles?
Who is the Brand Ambassador of Incredible India?
Why is there a time difference of about 5 hours between class 10 social science CBSE
Write a letter to the principal requesting him to grant class 10 english CBSE
A moving boat is observed from the top of a 150 m high class 10 maths CBSE