


Alexander Von Humboldt described for the first time?
A. Ecological Diversity
B. Laws of limiting factor
C. Species Area Relationship
D. Population growth equation
Answer
639.6k+ views
Hint: Alexander Von Humboldt observed something related to the richness in organisms while he was exploring the South American wilderness.
Complete answer:
Alexander Von Humboldt during his exploration found out that species richness increased with the increase in explored area, but it was up to a certain limit. He later saw that the relationship between species richness and area turned out to be a rectangular hyperbola for a wide variety of organisms like birds, bats, fishes, and flowering plants.
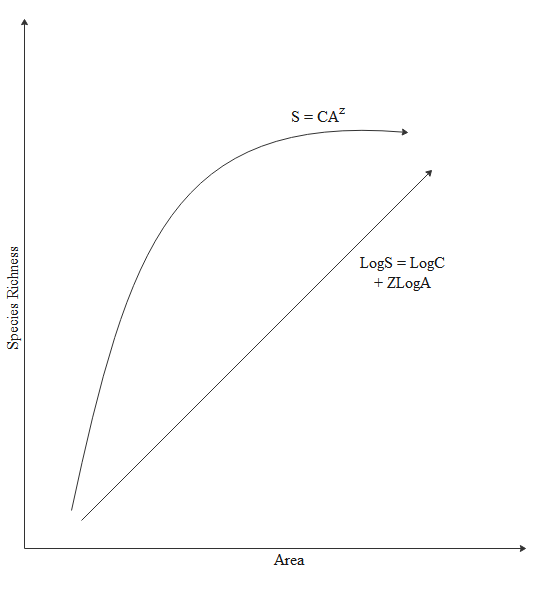
Species area relationship becomes linear in the logarithmic scale as shown in the above diagram.
The parameters of the graph are as follows:
S represents species richness, Z is the regression coefficient, C is the Y-intercept and A is the area.
Additional Information:
- The regression coefficient Z has a value of 0.1-0.2 regardless of the taxonomic group or area.
- For extremely large areas like an entire continent the value of Z ranges from 0.6-1.2.
- For the mammals of tropical forests of different continents, the value of the regression coefficient or Z is around 1.15.
- Species diversity is the variety in the number of species in a region and the species richness in an area.
- Species evenness is represented by the number of individuals of different species.
- Species richness is the number of species per unit area.
So, the correct answer is, ‘Alexander Von Humboldt described for the first time the Species Area Relationship’
Note: It should be remembered that the species-area relationship is related to species richness and explored area and not species evenness. The value of the regression coefficient increases when the area explored is very large, which means the slope is steeper. The relationship of species richness and area is normally a hyperbola but becomes a straight line in the logarithmic scale.
Complete answer:
Alexander Von Humboldt during his exploration found out that species richness increased with the increase in explored area, but it was up to a certain limit. He later saw that the relationship between species richness and area turned out to be a rectangular hyperbola for a wide variety of organisms like birds, bats, fishes, and flowering plants.
Species area relationship becomes linear in the logarithmic scale as shown in the above diagram.
The parameters of the graph are as follows:
S represents species richness, Z is the regression coefficient, C is the Y-intercept and A is the area.
Additional Information:
- The regression coefficient Z has a value of 0.1-0.2 regardless of the taxonomic group or area.
- For extremely large areas like an entire continent the value of Z ranges from 0.6-1.2.
- For the mammals of tropical forests of different continents, the value of the regression coefficient or Z is around 1.15.
- Species diversity is the variety in the number of species in a region and the species richness in an area.
- Species evenness is represented by the number of individuals of different species.
- Species richness is the number of species per unit area.
So, the correct answer is, ‘Alexander Von Humboldt described for the first time the Species Area Relationship’
Note: It should be remembered that the species-area relationship is related to species richness and explored area and not species evenness. The value of the regression coefficient increases when the area explored is very large, which means the slope is steeper. The relationship of species richness and area is normally a hyperbola but becomes a straight line in the logarithmic scale.
Recently Updated Pages
Master Class 12 Economics: Engaging Questions & Answers for Success
Master Class 12 English: Engaging Questions & Answers for Success
Master Class 12 Social Science: Engaging Questions & Answers for Success
Master Class 12 Maths: Engaging Questions & Answers for Success
Master Class 12 Physics: Engaging Questions & Answers for Success
Master Class 9 General Knowledge: Engaging Questions & Answers for Success
Trending doubts
One Metric ton is equal to kg A 10000 B 1000 C 100 class 11 physics CBSE
Difference Between Prokaryotic Cells and Eukaryotic Cells
Two of the body parts which do not appear in MRI are class 11 biology CBSE
1 ton equals to A 100 kg B 1000 kg C 10 kg D 10000 class 11 physics CBSE
Draw a diagram of nephron and explain its structur class 11 biology CBSE
10 examples of friction in our daily life