


Age of students (in years) \[5-7\] \[7-9\] \[9-11\] \[11-13\] \[13-15\] \[15-17\] \[17-19\] Number of students \[20\] \[18\] \[22\] \[25\] \[20\] \[15\] \[10\]
In annual day of a school, age wise participation of students is shown in the following frequency distribution:
Draw a “less than type” graph for the above data.
| Age of students (in years) | \[5-7\] | \[7-9\] | \[9-11\] | \[11-13\] | \[13-15\] | \[15-17\] | \[17-19\] |
| Number of students | \[20\] | \[18\] | \[22\] | \[25\] | \[20\] | \[15\] | \[10\] |
Answer
567.6k+ views
Hint: From the given question we are asked to draw a “less than type” graph for the above data where we are given that age and number of students participating in the annual day. For finding the graph we will take the help of statistics and explain the cumulative frequency term and find the table for cumulative frequency. After finding the cumulative frequency to the number of students' tables we will plot the graph.
Complete step by step answer:
Generally, in statistics the cumulative frequency is calculated by adding each frequency from a frequency distribution table to the sum of its predecessors. The last value will always be equal to the total for all observations, since all frequencies will already have been added to the previous total.
So, the table of the cumulative frequency to number of students will be as follows.
So, for our given question cumulative frequency will be the sum of total number of students of previous and that present class.
Here we take the students as x coordinate and cumulative frequency as y coordinate and draw the graph.
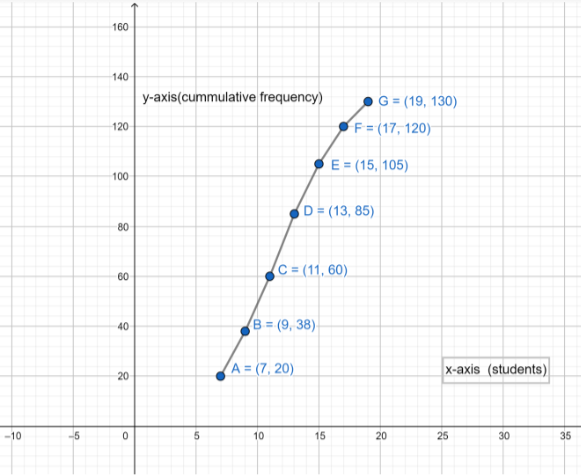
This curve is the required cumulative frequency curve or an ogive of the less than type curve.
Here,
\[\Rightarrow N=130\]
So, \[\Rightarrow \dfrac{N}{2}=65\]
Now we locate the point on the ogive curve whose ordinate is \[65\]. The x coordinate corresponding to this ordinate is \[11.4\].
Hence, the required median on the graph is \[11.4\].
Note: Students must be very careful in plotting the points. A general curve is defined as a frequency distribution graph of a series. We should take a perfect scale in the graph so that the graph does not become difficult to understand or not become big one. So, we must take the unit in the x-axis as \[2\] and the y axis as \[10\]. We must know that for a frequency distribution table the last value of the cumulative frequency will always be equal to the total for all observations, in our question total no of students.
Complete step by step answer:
Generally, in statistics the cumulative frequency is calculated by adding each frequency from a frequency distribution table to the sum of its predecessors. The last value will always be equal to the total for all observations, since all frequencies will already have been added to the previous total.
So, the table of the cumulative frequency to number of students will be as follows.
So, for our given question cumulative frequency will be the sum of total number of students of previous and that present class.
| Students | Cumulative frequency |
| Less than \[7\] | \[20\] |
| Less than \[9\] | \[38\] |
| Less than \[11\] | \[60\] |
| Less than \[13\] | \[85\] |
| Less than \[15\] | \[105\] |
| Less than \[17\] | \[120\] |
| Less than \[19\] | \[130\] |
Here we take the students as x coordinate and cumulative frequency as y coordinate and draw the graph.
This curve is the required cumulative frequency curve or an ogive of the less than type curve.
Here,
\[\Rightarrow N=130\]
So, \[\Rightarrow \dfrac{N}{2}=65\]
Now we locate the point on the ogive curve whose ordinate is \[65\]. The x coordinate corresponding to this ordinate is \[11.4\].
Hence, the required median on the graph is \[11.4\].
Note: Students must be very careful in plotting the points. A general curve is defined as a frequency distribution graph of a series. We should take a perfect scale in the graph so that the graph does not become difficult to understand or not become big one. So, we must take the unit in the x-axis as \[2\] and the y axis as \[10\]. We must know that for a frequency distribution table the last value of the cumulative frequency will always be equal to the total for all observations, in our question total no of students.
Recently Updated Pages
Master Class 11 English: Engaging Questions & Answers for Success
Master Class 11 Social Science: Engaging Questions & Answers for Success
Master Class 11 Maths: Engaging Questions & Answers for Success
Master Class 11 Chemistry: Engaging Questions & Answers for Success
Master Class 11 Biology: Engaging Questions & Answers for Success
Master Class 11 Physics: Engaging Questions & Answers for Success
Trending doubts
Explain the Treaty of Vienna of 1815 class 10 social science CBSE
Why is it 530 pm in india when it is 1200 afternoon class 10 social science CBSE
What is the full form of CNG A Complete Natural Gas class 10 social science CBSE
In cricket, what is a "Yorker" designed to do?
What is the full form of POSCO class 10 social science CBSE
Define Potential, Developed, Stock and Reserved resources