


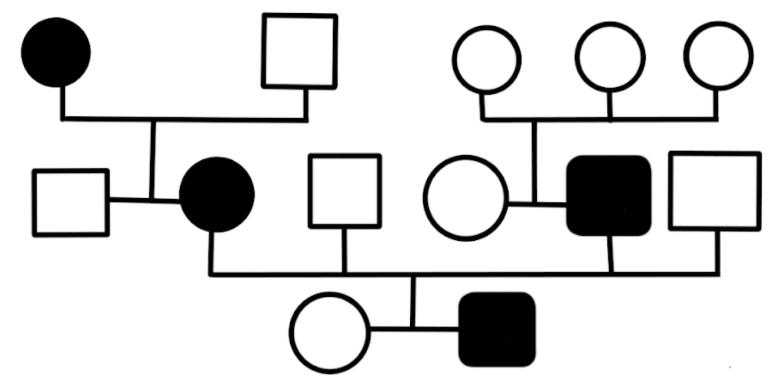
Above pedigree chart show
A. Autosomal dominant trait
B. Sex-linked recessive trait
C. Autosomal recessive trait
D. Sex-linked dominant trait
Answer
597.6k+ views
Hint: A pedigree is a systematic listing (either as words or symbols) of the ancestors of a given individual, or it may be the "family tree" for a number of individuals. In these charts, females are represented as circles and males as squares.
Complete Answer:
- In this pedigree chart Mating is shown as horizontal lines between two individuals. The offspring of a mating are connected by vertical line to the mating line. Different shades or colours added to the symbols can represent various phenotypes.
- In the above given pedigree chart, it can be seen that affected individuals are found in every generation which means it’s a dominant trait because recessive traits occur in alternate generations only. So it can be concluded that affected individuals are due to the dominant allele of a particular trait present in them.
- It also shows that the male and female are equally affected at every generation which means it is autosomal trait because sex-linked affects particular sex only.
The correct option is (A) i.e. autosomal dominant trait.
Note: In human beings pedigree analysis is used to know the transmission of specific traits because of following reasons:
- Mating cannot be controlled. To set up controlled mating experiments are not ethical or feasible.
- Generation time is long in human beings, so it takes a long time to track inheritance of traits over more than one generation.
- The total number of offspring per mating is limited, so phenotypic ratios are uncertain.
Recently Updated Pages
Master Class 9 General Knowledge: Engaging Questions & Answers for Success
Master Class 9 Maths: Engaging Questions & Answers for Success
Master Class 9 Science: Engaging Questions & Answers for Success
Master Class 9 English: Engaging Questions & Answers for Success
Master Class 9 Social Science: Engaging Questions & Answers for Success
Class 9 Question and Answer - Your Ultimate Solutions Guide
Trending doubts
Which are the Top 10 Largest Countries of the World?
Draw a labelled sketch of the human eye class 12 physics CBSE
Differentiate between homogeneous and heterogeneous class 12 chemistry CBSE
Sulphuric acid is known as the king of acids State class 12 chemistry CBSE
Why is the cell called the structural and functional class 12 biology CBSE
A dentist uses a small mirror that gives a magnification class 12 physics CBSE