


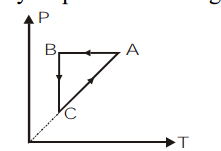
\[ABCA\] is a cyclic process. Its \[P-V\] graph would be
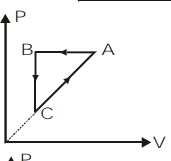
\[A)\]
\[B)\]
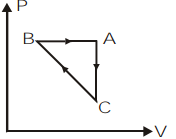
\[C)\]

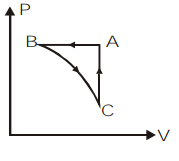
\[D)\]
Answer
624k+ views
Hint: We will use the ideal gas relation \[PV\propto nT\] for analysis of all three processes given in the \[P-T\] graph and convert the data into \[P-V\] graph. The given process \[ABCA\] is a cyclic process but it is completing one cycle with 3 processes. So we will need to convert each process separately.
Complete step by step answer:
The given process \[ABCA\] completes one cycle by undergoing 3 cycles as \[BC\], \[CA\] and \[AB\]. We can plot the \[P-V\] graph of the given process by analyzing the given \[P-T\] graph individually for each process.
Let us take the first process \[BC\] on the \[P-T\] graph. We can observe that the temperature remains constant for this process and pressure is decreasing. So by the ideal gas equation, at constant temperature, \[P \propto \dfrac{1}{V}\]. So as the pressure is decreasing, the volume will increase.
Now, let us take the process \[CA\] on the \[P-T\] graph. Here, we can observe the temperature and pressure increasing as per the ideal gas relation $P \propto T$. But this relation is valid only at constant volume. So in the \[P-V\] graph there will be no change in volume.
Then, we will consider the last process in this cyclic process which is \[AB\]. If we look at the \[P-T\] graph of this process we can understand that pressure remains constant and temperature is decreasing. So, according to the ideal gas relation, at constant pressure, \[V\propto T\]. That means the volume will decrease. So in the \[P-V\] graph the pressure remains constant and volume will decrease.
So, we can plot the \[P-V\] graph of the given cyclic process \[ABCA\] as,
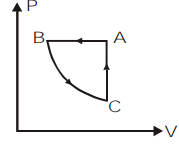
So, the correct answer is option c.
Note:
We can solve this question only by using the relationship between the parameters given by the ideal gas equation. But we can solve this question quickly by just analyzing each process and the variations occurring in that process and converting it to the desired plot if we know the relation between P, V and T according to the ideal gas relation.
Complete step by step answer:
The given process \[ABCA\] completes one cycle by undergoing 3 cycles as \[BC\], \[CA\] and \[AB\]. We can plot the \[P-V\] graph of the given process by analyzing the given \[P-T\] graph individually for each process.
Let us take the first process \[BC\] on the \[P-T\] graph. We can observe that the temperature remains constant for this process and pressure is decreasing. So by the ideal gas equation, at constant temperature, \[P \propto \dfrac{1}{V}\]. So as the pressure is decreasing, the volume will increase.
Now, let us take the process \[CA\] on the \[P-T\] graph. Here, we can observe the temperature and pressure increasing as per the ideal gas relation $P \propto T$. But this relation is valid only at constant volume. So in the \[P-V\] graph there will be no change in volume.
Then, we will consider the last process in this cyclic process which is \[AB\]. If we look at the \[P-T\] graph of this process we can understand that pressure remains constant and temperature is decreasing. So, according to the ideal gas relation, at constant pressure, \[V\propto T\]. That means the volume will decrease. So in the \[P-V\] graph the pressure remains constant and volume will decrease.
So, we can plot the \[P-V\] graph of the given cyclic process \[ABCA\] as,
So, the correct answer is option c.
Note:
We can solve this question only by using the relationship between the parameters given by the ideal gas equation. But we can solve this question quickly by just analyzing each process and the variations occurring in that process and converting it to the desired plot if we know the relation between P, V and T according to the ideal gas relation.
Recently Updated Pages
Master Class 12 Economics: Engaging Questions & Answers for Success
Master Class 12 English: Engaging Questions & Answers for Success
Master Class 12 Social Science: Engaging Questions & Answers for Success
Master Class 12 Maths: Engaging Questions & Answers for Success
Master Class 12 Physics: Engaging Questions & Answers for Success
Master Class 11 Social Science: Engaging Questions & Answers for Success
Trending doubts
One Metric ton is equal to kg A 10000 B 1000 C 100 class 11 physics CBSE
Difference Between Prokaryotic Cells and Eukaryotic Cells
Two of the body parts which do not appear in MRI are class 11 biology CBSE
1 ton equals to A 100 kg B 1000 kg C 10 kg D 10000 class 11 physics CBSE
Draw a diagram of nephron and explain its structur class 11 biology CBSE
10 examples of friction in our daily life