


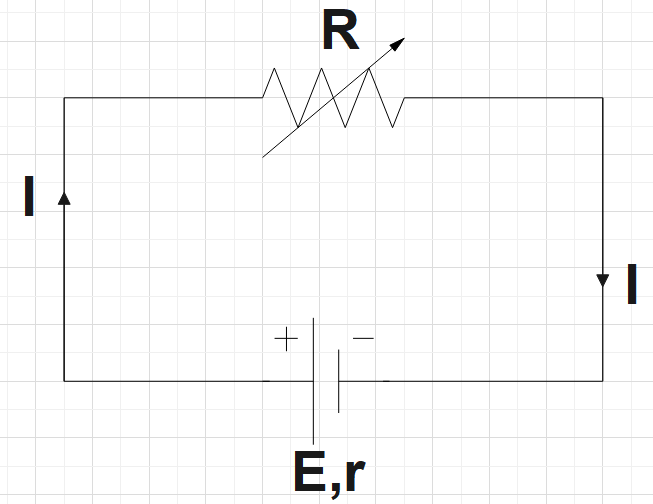
A variable resistor R is connected across a cell of emf E and internal resistance r as shown in the figure below. Draw a plot showing the variation of
(a) terminal voltage V and
(b) the current I as a function of R.
Answer
553.2k+ views
Hint: As a first step, one could read the question well and then analyse the circuit. One could then recall the relationship between the quantities of which we are supposed to make the plot. So, you could use these relations so as to make the plots we are asked to make.
Formula used:
Current $I=\dfrac{E}{R+r}$
Terminal voltage $V=E-Ir$
Complete step by step solution:
In the question, we are given a circuit in which a variable resistor R is connected across a cell that is known to have an emf E and internal resistance r. We are supposed to make two plots for this circuit. One with terminal voltage V as a function of R and another with current I as a function of R.
In order to answer this question, we have to recall the relationship between current and voltage with the resistance R.
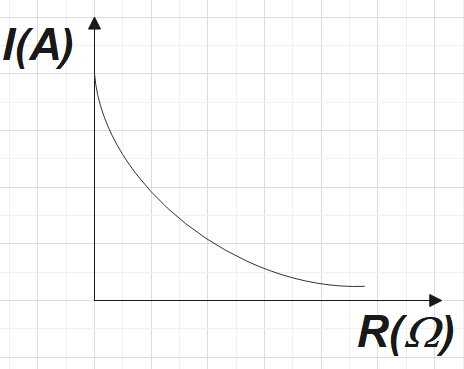
The current as a function of R is given by the following relation,
$I=\dfrac{E}{R+r}$
Clearly, when resistance increases, the current decreases.
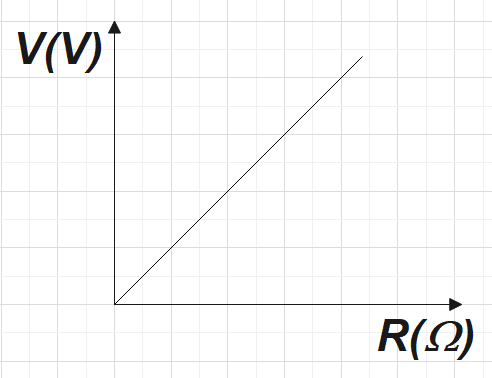
Now the terminal voltage as a function of R could be given by,
$V=E-Ir$
From the above relation we have current decreasing with increase in value of resistance, from this relation we could conclude that terminal voltage increases with increase in value of resistance.
(a) plot of terminal voltage against resistance.
(b) the plot of current versus resistance.
Note: While making a plot of two physical quantities, one could recall the relationship between the two quantities. Here, we have begun from the relation of current with resistance firstly because it is from this relation that we could make a conclusion necessary for making the plot for the second part.
Formula used:
Current $I=\dfrac{E}{R+r}$
Terminal voltage $V=E-Ir$
Complete step by step solution:
In the question, we are given a circuit in which a variable resistor R is connected across a cell that is known to have an emf E and internal resistance r. We are supposed to make two plots for this circuit. One with terminal voltage V as a function of R and another with current I as a function of R.
In order to answer this question, we have to recall the relationship between current and voltage with the resistance R.
The current as a function of R is given by the following relation,
$I=\dfrac{E}{R+r}$
Clearly, when resistance increases, the current decreases.
Now the terminal voltage as a function of R could be given by,
$V=E-Ir$
From the above relation we have current decreasing with increase in value of resistance, from this relation we could conclude that terminal voltage increases with increase in value of resistance.
(a) plot of terminal voltage against resistance.
(b) the plot of current versus resistance.
Note: While making a plot of two physical quantities, one could recall the relationship between the two quantities. Here, we have begun from the relation of current with resistance firstly because it is from this relation that we could make a conclusion necessary for making the plot for the second part.
Recently Updated Pages
Master Class 12 Business Studies: Engaging Questions & Answers for Success
Master Class 12 Chemistry: Engaging Questions & Answers for Success
Master Class 12 Biology: Engaging Questions & Answers for Success
Class 12 Question and Answer - Your Ultimate Solutions Guide
Master Class 11 English: Engaging Questions & Answers for Success
Master Class 11 Social Science: Engaging Questions & Answers for Success
Trending doubts
Which are the Top 10 Largest Countries of the World?
Draw a labelled sketch of the human eye class 12 physics CBSE
The end of compass needle which points towards north class 12 physics CBSE
Differentiate between homogeneous and heterogeneous class 12 chemistry CBSE
Why is the cell called the structural and functional class 12 biology CBSE
When was the first election held in India a 194748 class 12 sst CBSE