


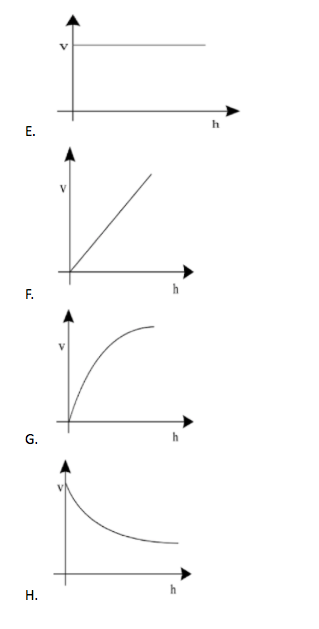
A uniform rope having some mass hangs vertically from a rigid support. A transverse wave pulse is produced at the lower end. The speed of the wave pulse varies with height from the lower end as:
Answer
619.8k+ views
Hint:We can use the formula for the tension generated in the rope. Tension at a some height from bottom$ = $ weight of the rope below it$ = \rho Ahg$
$\rho = $ rope density, A is cross sectional area
Speed of wave$ = \sqrt {\frac{T}{\mu }} $
Step by step solution:
To solve this question we have to calculate the relation between the $v$ and $h$ . To find the relation we can use the formula for the tension and the speed of the wave formula.
Tension in the rope at $h$ from the bottom$ = $ Weight of the rope below it$ = \rho Ahg$
Speed of the wave pulse,$v = \sqrt {\frac{T}{\mu }} $
Putting the value of tension in the above formula.
We get,
$\begin{gathered}
\Rightarrow v = \sqrt {\frac{{\rho Ahg}}{\mu }} \\
\Rightarrow v \propto \sqrt h \\
\end{gathered} $
Hence, we can see that the speed is directly proportional to the square root of the height. Hence we can now predict the nature of the graph.
Graph 1 is a constant function, Graph 2 is a straight line graph, Graph 4 is an exponential graph.
Therefore, option C is correct.
Note:While solving this type of question we should have some understanding of the curve tracing concept so that we can easily predict the output graph. We should also be able to get the relationship between the quantities which are to be represented on the graph. We should avoid unnecessary computations to get the answer quickly.
Recently Updated Pages
Master Class 5 English: Engaging Questions & Answers for Success
Master Class 5 Maths: Engaging Questions & Answers for Success
Master Class 5 Social Science: Engaging Questions & Answers for Success
Master Class 5 Science: Engaging Questions & Answers for Success
Class 5 Question and Answer - Your Ultimate Solutions Guide
Master Class 9 General Knowledge: Engaging Questions & Answers for Success
Trending doubts
One Metric ton is equal to kg A 10000 B 1000 C 100 class 11 physics CBSE
What is cell theory Who formulated it class 11 biology CBSE
Phyllotaxy is the arrangement of ALeaflets BLeaves class 11 biology CBSE
Difference Between Prokaryotic Cells and Eukaryotic Cells
The symbiotic association of fungi and algae is called class 11 biology CBSE
Cell theory was formulated by A Schleiden and Schwann class 11 biology CBSE