


A taxi driver drove a taxi for 6 hours. Plot a speed-distance graph for the following data.
Speed (in km/hr) 20 25 30 40 50 Distance (in Km) 120 150 180 240 300
| Speed (in km/hr) | 20 | 25 | 30 | 40 | 50 |
| Distance (in Km) | 120 | 150 | 180 | 240 | 300 |
Answer
640.8k+ views
Hint – In this question plot the points for the speed of the taxi driver on y-axis and the distance traveled on the x-axis. First plot the points corresponding to distance for the corresponding to the speed, and then join the points to form a straight line.
Complete step-by-step answer:
The speed – distance graph for the given data is shown below,
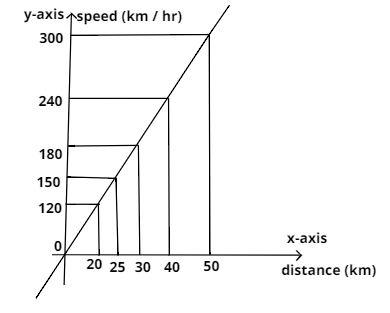
Where distance is on x-axis in kilometer and speed is on y-axis in kilometer per hour.
So this is the required plot between speed and distance.
So this is the required answer.
Note – There is a bit of confusion that the straight line of speed vs distance plot depicts uniform motion, however in actual we can determine whether the object exhibits uniform motion or more accurately by looking at the position-time graph of the motion. A straight line for the curve depicts a uniform motion.
Complete step-by-step answer:
The speed – distance graph for the given data is shown below,
Where distance is on x-axis in kilometer and speed is on y-axis in kilometer per hour.
So this is the required plot between speed and distance.
So this is the required answer.
Note – There is a bit of confusion that the straight line of speed vs distance plot depicts uniform motion, however in actual we can determine whether the object exhibits uniform motion or more accurately by looking at the position-time graph of the motion. A straight line for the curve depicts a uniform motion.
Recently Updated Pages
Master Class 12 Business Studies: Engaging Questions & Answers for Success
Master Class 12 Biology: Engaging Questions & Answers for Success
Master Class 12 Chemistry: Engaging Questions & Answers for Success
Class 12 Question and Answer - Your Ultimate Solutions Guide
Master Class 11 Social Science: Engaging Questions & Answers for Success
Master Class 11 English: Engaging Questions & Answers for Success
Trending doubts
What is the Full Form of ICSE / ISC ?
Fill the blanks with the suitable prepositions 1 The class 9 english CBSE
Difference Between Plant Cell and Animal Cell
How many hours before the closure of election must class 9 social science CBSE
What is pollution? How many types of pollution? Define it
Name 10 Living and Non living things class 9 biology CBSE