


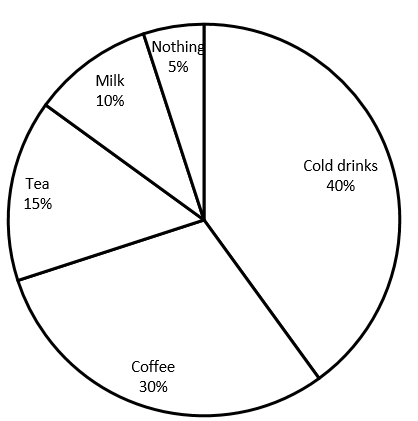
A survey was carried out to find the favourite beverage preferred by a certain group of young people. The following pie chart shows the findings of this survey. From this pie chart answer the following:
(i) Which type of beverage is liked by the maximum number of people?
(ii) If \[45\] people like tea, how many people were surveyed?
(iii) Find the number of people who like coffee in the total number of people surveyed.
Answer
564.9k+ views
Hint: The given question is based on the topic data interpretation in which collected numerical data is analysed and interpreted. This collection may be represented either in table or in graphs and diagrams. Pie-chart or pie-graph is the method of representing a given numerical data in the form of sectors of a circle. These types of questions are easy to solve just by looking at the chart and with simple calculations. Here also we are going to answer the given questions just by observing the pie-chart.
Complete answer:
From the pie-chart it is clear that cold drinks is liked by \[40\% \] of people, coffee is liked by \[30\% \] of people, tea is liked by \[15\% \] of people, milk is liked by \[10\% \] of people and \[5\% \] people don’t like any kind of beverages.
(i) Which type of beverage is liked by the maximum number of people?
The maximum percentage in the pie-chart is \[40\% \], so obviously \[40\% \] gives the maximum number of people. Therefore, the maximum number of cold drinks is the beverage liked by the maximum number of people by \[40\% \].
(ii) If \[45\] people like tea, how many people were surveyed?
The percentage of people who liked tea given in the pie-chart is \[15\% \], and now it is given to \[45\] people out of the total number of people surveyed. And we are asked to find the total number of people surveyed.
That is, tea is liked by \[45 \Rightarrow 15\% \] in the total number of people surveyed.
\[\therefore \dfrac{{15}}{{100}} \times {\text{total number of people = 45}}\]
Cancelling both \[15\] and \[100\] by \[5\] we will get,
\[\dfrac{3}{{20}} \times {\text{total number of people = 45}}\]
If \[\dfrac{3}{{20}}\] goes that side of equal then it becomes \[\dfrac{{20}}{3}\],
\[{\text{total number of people = 45}} \times \dfrac{{20}}{3}\]
Cancelling \[45\] by the denominator \[3\],
\[ = 15 \times 20\]
\[ = 300\].
\[\therefore \]The total number of people surveyed is \[300\].
(iii) Find the number of people who like coffee in the total number of people surveyed.
Here we are asked to find the total number of people who like coffee. It is given in the pie-chart that coffee is liked by \[30\% \] of people. Let's consider the number of people who like coffee as \[x\].
We have already found that the total number of people surveyed is \[300\].
\[\therefore x = \dfrac{{30}}{{100}} \times {\text{total number of people}}\]
\[ = \dfrac{{30}}{{100}} \times 300\]
By cancelling zeroes in \[100\] and \[300\] ,
\[ = 30 \times 3\]
\[ = 90\].
Hence, \[90\] people like coffee.
Note:
Pie-charts are effective for showing percentage (parts of a whole) but they are ineffective in showing quantities, totals or comparisons. Here the numerical data are represented in the form of percentage (\[\% \]) therefore total percentage \[\% \] is always out of \[100\% \] and the formula based on the percentage is: \[{\text{results on percentage}} = \dfrac{{{\text{percentage obtained}}}}{{100}} \times {\text{total}}\].
Recently Updated Pages
Basicity of sulphurous acid and sulphuric acid are
Master Class 12 Economics: Engaging Questions & Answers for Success
Master Class 12 Biology: Engaging Questions & Answers for Success
Master Class 11 English: Engaging Questions & Answers for Success
Master Class 11 Physics: Engaging Questions & Answers for Success
Master Class 11 Computer Science: Engaging Questions & Answers for Success
Trending doubts
Draw a labelled sketch of the human eye class 12 physics CBSE
The chemical formula of tear gas is A CO Cl 2 B C 10 class 12 chemistry CBSE
Draw ray diagrams each showing i myopic eye and ii class 12 physics CBSE
Which are the Top 10 Largest Countries of the World?
Which is the correct genotypic ratio of mendel dihybrid class 12 biology CBSE
Draw a ray diagram of compound microscope when the class 12 physics CBSE