


A survey conducted by an organisation for the cause of illness and death among the women between the age 15-44 (in years) worldwide, found the following figures (in %)
I.Represent the information given above graphically
II.Which condition is the major cause of women’s ill health and death worldwide?
III.Try to find out, with the help of your teacher, any two factors which play a major role in the cause in (ii) above being the major cause.
S.No. Causes Female fatality rate (%) 1 Reproductive health conditions 31.8 2 Neuropsychiatric conditions 25.4 3 Injuries 12.4 4 Cardiovascular conditions 4.3 5 Respiratory conditions 4.1 6 Other causes 22.0
| S.No. | Causes | Female fatality rate (%) |
| 1 | Reproductive health conditions | 31.8 |
| 2 | Neuropsychiatric conditions | 25.4 |
| 3 | Injuries | 12.4 |
| 4 | Cardiovascular conditions | 4.3 |
| 5 | Respiratory conditions | 4.1 |
| 6 | Other causes | 22.0 |
Answer
622.2k+ views
Hint: In the bar graph, we draw bars of uniform width with equal spacing between them on one axis with various heights. We shall later observe the graph and analyse the major cause of women’s ill health.
Complete step-by-step answer:
Bar graphs can be used to show how something changes over time or to compare items. They have an x-axis (horizontal) and a y-axis (vertical). Typically, the x-axis has numbers for the time period or what is being measured, and the y-axis has numbers for the amount of stuff being measured.
We draw the bar graph of the data choosing the causes on the x-axis, and female fatality on the y axis. Along the x-axis, we take equal width for all boxes and maintain equal gaps in between them, let one cause be represented by 1 unit along the Y-axis, we take the scale as 1 unit = 4%.
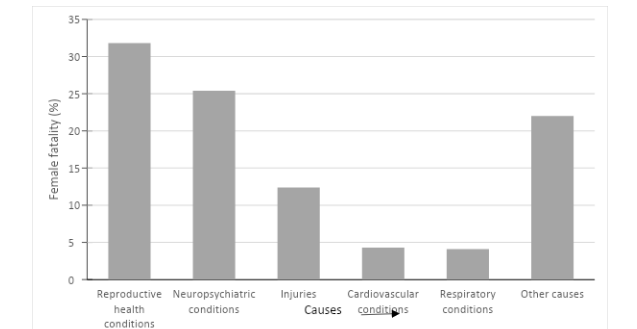
(ii) From the graph we observe that reproductive health conditions is the major causes of women’s ill health & death worldwide.
(iii) The factors are as follows:
A.Lack of knowledge among the women about various complications and steps to be taken to overcome the difficulties.
B.Lack of medical facilities
Note: Bar graph is the simple graphical representation when class intervals are not mentioned. Any other graphical representation can be used.
Complete step-by-step answer:
Bar graphs can be used to show how something changes over time or to compare items. They have an x-axis (horizontal) and a y-axis (vertical). Typically, the x-axis has numbers for the time period or what is being measured, and the y-axis has numbers for the amount of stuff being measured.
We draw the bar graph of the data choosing the causes on the x-axis, and female fatality on the y axis. Along the x-axis, we take equal width for all boxes and maintain equal gaps in between them, let one cause be represented by 1 unit along the Y-axis, we take the scale as 1 unit = 4%.
(ii) From the graph we observe that reproductive health conditions is the major causes of women’s ill health & death worldwide.
(iii) The factors are as follows:
A.Lack of knowledge among the women about various complications and steps to be taken to overcome the difficulties.
B.Lack of medical facilities
Note: Bar graph is the simple graphical representation when class intervals are not mentioned. Any other graphical representation can be used.
Recently Updated Pages
Master Class 12 Economics: Engaging Questions & Answers for Success
Master Class 12 English: Engaging Questions & Answers for Success
Master Class 12 Social Science: Engaging Questions & Answers for Success
Master Class 12 Maths: Engaging Questions & Answers for Success
Master Class 12 Physics: Engaging Questions & Answers for Success
Master Class 8 English: Engaging Questions & Answers for Success
Trending doubts
What is BLO What is the full form of BLO class 8 social science CBSE
Citizens of India can vote at the age of A 18 years class 8 social science CBSE
Right to vote is a AFundamental Right BFundamental class 8 social science CBSE
Full form of STD, ISD and PCO
What is the area formula of an obtuse triangle class 8 maths CBSE
Give me the opposite gender of Duck class 8 english CBSE