


A source of sound emits sound waves at frequency $ {f_0} $. It is moving towards an observer with fixed speed ( $ {v_s} $ ( $ {v_s} < v $ ) where $ v $ is the speed of sound in air). If the observer were to move towards the source with speed $ {v_0} $, one of the following two graphs (A and B) will give the correct variation of the frequency f heard by the observer as $ {v_0} $ is changed.
The variation $ f $ of with $ {v_0} $ is given by:
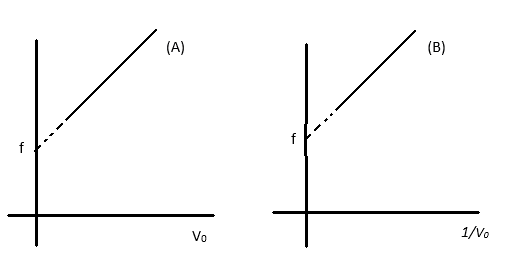
(A) Graph A with slope $ \dfrac{{{f_0}}}{{v - {v_s}}} $
(B) Graph A with slope $ \dfrac{{{f_0}}}{{v + {v_s}}} $
(C) Graph B with slope $ \dfrac{{{f_0}}}{{v - {v_s}}} $
(D) Graph B with slope $ \dfrac{{{f_0}}}{{v + {v_s}}} $
Answer
615.9k+ views
Hint
For an observer moving towards a source, the frequency of the sound as heard by the observer is greater than that for a stationary observer. It is likewise for when the source is moving towards an observer. So from the equation for Doppler Effect, we need to write in the form of the equation of a straight line. From there we will get the answer.
Formula used: In this solution we will be using the following formula,
$ \Rightarrow f = {f_0}\dfrac{{{v_0} + v}}{{v - {v_s}}} $ where $ f $ is the frequency observed by the observer when the source and observer are moving towards each other, $ v $ is the speed of the sound waves, $ {v_0} $ is the speed of the observer and $ {v_s} $ is the speed of the source.
Equation of a straight line is given by $ y = mx + c $ where $ y $ is the independent variable, $ x $ is the dependent variable $ c $ is the intercept and $ m $ is the slope of the graph.
Complete step by step answer
When a source is moving towards a stationary observer, the frequency observed by the observer is greater than when the source was stationary. Similarly, when the observer is moving toward a stationary source, the frequency as observed by the observer is also greater than for a stationary observer. This phenomenon is known as the Doppler Effect. When they are both moving towards each other, the frequency is even greater still. The frequency in this case is given by
$ \Rightarrow f = {f_0}\dfrac{{{v_0} + v}}{{v - {v_s}}} $ where $ f $ is the frequency observed by the observer when the source and observer are moving towards each other. $ v $ is the speed of the sound waves, $ {v_0} $ is the speed of the observer and $ {v_s} $ is the speed of the source.
On splitting the formula into two terms, we have
$ \Rightarrow f = \dfrac{{{f_0}}}{{v - {v_s}}}{v_0} + \dfrac{{{f_0}v}}{{v - {v_s}}} $.
Comparing this equation with the equation of a straight line
$ \Rightarrow y = mx + c $ where $ y $ is the independent variable, $ x $ is the dependent variable $ c $ is the intercept and $ m $ is the slope of the graph, we see that the slope $ m $ is given by
$ \Rightarrow m = \dfrac{{{f_0}}}{{v - {v_s}}} $ (since the independent variable is $ {v_0} $ )
Hence, for graph of $ f $ against $ {v_0} $ the slope of the graph is $ m = \dfrac{{{f_0}}}{{v - {v_s}}} $
Thus the correct option is (A).
Note
The Doppler Effect has some applications in real life. For example, it is used in radars and sonars to detect the speed of an object. The Doppler Effect can also be observed in light and other forms of waves.
Recently Updated Pages
Master Class 11 English: Engaging Questions & Answers for Success
Master Class 11 Social Science: Engaging Questions & Answers for Success
Master Class 11 Maths: Engaging Questions & Answers for Success
Master Class 11 Biology: Engaging Questions & Answers for Success
Master Class 11 Physics: Engaging Questions & Answers for Success
Master Class 11 Chemistry: Engaging Questions & Answers for Success
Trending doubts
One Metric ton is equal to kg A 10000 B 1000 C 100 class 11 physics CBSE
What is cell theory Who formulated it class 11 biology CBSE
Phyllotaxy is the arrangement of ALeaflets BLeaves class 11 biology CBSE
Difference Between Prokaryotic Cells and Eukaryotic Cells
The symbiotic association of fungi and algae is called class 11 biology CBSE
Cell theory was formulated by A Schleiden and Schwann class 11 biology CBSE