


How should a scatter plot of data look if there is a negative correlation?
Answer
533.4k+ views
Hint: To answer this question, we first need to know what correlation is what the different types of correlation are. We explain the term correlation and scatter plot. Then, according to the given definitions, we try to plot an approximate scatter plot for the data if there is a negative correlation.
Complete step by step solution:
Correlation is a statistical term which is used to measure the relationship between two variables. There are different types of correlation and are given as follows:
Positive correlation: If the value of one variable increases with a corresponding increase in the other variable, then there exists a positive correlation between the two variables. An example for this could be the increased rate of fuel consumption by a car if the speed needs to be increased.
Negative correlation: If the value of one variable decreases with a corresponding increase in the other variable, then there exists a negative correlation between the two variables. An example for this is memory on the memory cards, the more we store on it, the lesser the memory there is left on it.
No correlation: If there is no dependency of one variable on the other, there is said to be no correlation between the two.
Now a scatter plot is a plot used to represent the data points on a plane with two perpendicular axes. Each of the axes represents a variable.
Knowing all this and having defined the negative correlation, we can show the scatter plot for the data in case of a negative correlation. This is shown in the below figure.
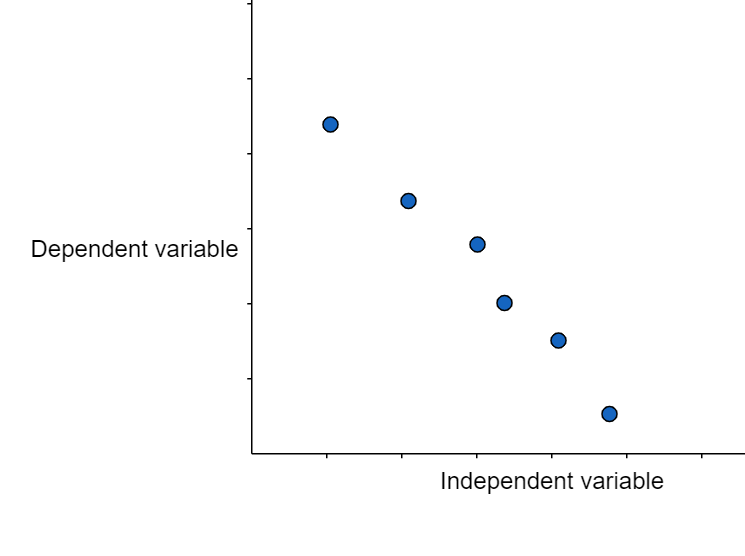
Since the points in this plot are close to each other and almost making a straight line, the variables are said to have a high correlation. Therefore, we can see that as one of the variables increases, which in this case is the independent variable, the dependent variable decreases. Thus, this scatter plot exhibits negative correlation.
Note: It is essential to know the concepts of correlation in order to solve these questions, knowing about the different types of correlation is a basic step for understanding correlation. Care must be taken while noting the difference between positive and negative correlation. They are quite the opposite of each other and both help in analysing and measuring the relation between different variables.
Complete step by step solution:
Correlation is a statistical term which is used to measure the relationship between two variables. There are different types of correlation and are given as follows:
Positive correlation: If the value of one variable increases with a corresponding increase in the other variable, then there exists a positive correlation between the two variables. An example for this could be the increased rate of fuel consumption by a car if the speed needs to be increased.
Negative correlation: If the value of one variable decreases with a corresponding increase in the other variable, then there exists a negative correlation between the two variables. An example for this is memory on the memory cards, the more we store on it, the lesser the memory there is left on it.
No correlation: If there is no dependency of one variable on the other, there is said to be no correlation between the two.
Now a scatter plot is a plot used to represent the data points on a plane with two perpendicular axes. Each of the axes represents a variable.
Knowing all this and having defined the negative correlation, we can show the scatter plot for the data in case of a negative correlation. This is shown in the below figure.
Since the points in this plot are close to each other and almost making a straight line, the variables are said to have a high correlation. Therefore, we can see that as one of the variables increases, which in this case is the independent variable, the dependent variable decreases. Thus, this scatter plot exhibits negative correlation.
Note: It is essential to know the concepts of correlation in order to solve these questions, knowing about the different types of correlation is a basic step for understanding correlation. Care must be taken while noting the difference between positive and negative correlation. They are quite the opposite of each other and both help in analysing and measuring the relation between different variables.
Recently Updated Pages
Master Class 11 Computer Science: Engaging Questions & Answers for Success
Master Class 11 Business Studies: Engaging Questions & Answers for Success
Master Class 11 Economics: Engaging Questions & Answers for Success
Master Class 11 English: Engaging Questions & Answers for Success
Master Class 11 Maths: Engaging Questions & Answers for Success
Master Class 11 Biology: Engaging Questions & Answers for Success
Trending doubts
One Metric ton is equal to kg A 10000 B 1000 C 100 class 11 physics CBSE
There are 720 permutations of the digits 1 2 3 4 5 class 11 maths CBSE
Discuss the various forms of bacteria class 11 biology CBSE
Draw a diagram of a plant cell and label at least eight class 11 biology CBSE
State the laws of reflection of light
Explain zero factorial class 11 maths CBSE