


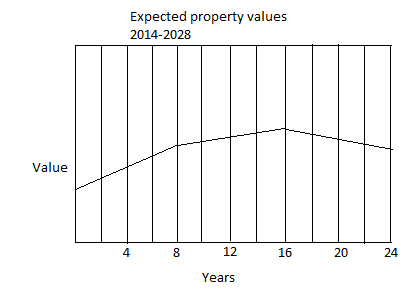
A realtor is studying the figure above, which shows the expected value of properties in her area over the next \[24\] years .If it represents the number of years after \[2014\], in what year should the increase in property value start to slow down?
(A) \[2008\]
(B) \[2018\]
(C) \[2022\]
(D) \[2030\]
Answer
603.6k+ views
Hint: In this question, the property values are given for specific years in graphical representation and the starting year also given.
We have to find out the year where the increase in property value starts to slow down.
We need to first observe the graph and find out the year where the increase in property value starts to slow down then we need to add that year with the starting year.
Complete step by step solution:
The given observations are the graphical representation of the expected property values from year \[2014 - 2028\].
We need to find out the year where the increase in property value starts to slow down.
We can see in the graph that the expected property values are going up till the year \[16\] after that it is going down.
The graph starts from the year \[2014\].
Thus the increase in property value start to slow down in \[2014 + 16 = 2030\]
$\therefore $ Option (D) is the correct option.
Note: Graphical representation:
Graphical representation refers to the use of charts and graphs to visually display, analyse, clarify, and interpret numerical data, functions, and other qualitative structures. Data is ingested into graphical representation of data software and then represented by a variety of symbols, such as lines on a line chart, bars on a bar chart, or slices on a pie chart, from which users can gain greater insight than by numerical analysis alone.
Recently Updated Pages
Master Class 12 Economics: Engaging Questions & Answers for Success
Master Class 12 English: Engaging Questions & Answers for Success
Master Class 12 Social Science: Engaging Questions & Answers for Success
Master Class 12 Maths: Engaging Questions & Answers for Success
Master Class 12 Physics: Engaging Questions & Answers for Success
Master Class 11 Social Science: Engaging Questions & Answers for Success
Trending doubts
One Metric ton is equal to kg A 10000 B 1000 C 100 class 11 physics CBSE
Difference Between Prokaryotic Cells and Eukaryotic Cells
Find the value of the expression given below sin 30circ class 11 maths CBSE
Two of the body parts which do not appear in MRI are class 11 biology CBSE
Draw a diagram of nephron and explain its structur class 11 biology CBSE
10 examples of friction in our daily life