


What is a normal probability curve?
Answer
572.4k+ views
Hint: we first describe the importance of the normal distribution and the components of its PDF. Then we discuss the normal probability curve and the use of mean and the standard deviation for the formula makes it unique for real life implications.
Complete step by step solution:
There are two main parameters which impact a normal distribution and they are mean and the standard deviation of the sample
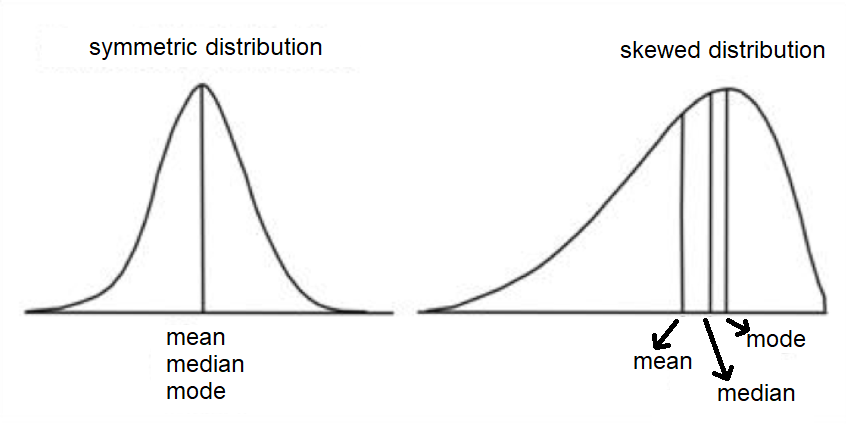
The normal curve shows the probability distribution for continuous random variable and the curve is bell-shaped. The graph of the probability density function of the normal distribution is symmetrical about the mean and it is called Normal Probability Curve.
Normal distributions become more perfect for finer level of measurement and larger sample.
The mean of the sample for the normal distribution creates the symmetry on its both sides so that the right side of the centre is a mirror image of the left side.
The probability density function of the normal distribution is $f\left( x \right)=\dfrac{1}{\sigma \sqrt{2\pi }}{{e}^{-\dfrac{1}{2}{{\left( \dfrac{x-\mu }{\sigma } \right)}^{2}}}}$ where $\mu $ is the mean and $\sigma $ is the standard deviation of the sample.
Note: Normal curve has great significance in social sciences and behavioural sciences. In behavioural measurement most of the aspects approximate to the normal distribution. The normal curve is unimodal.
Complete step by step solution:
There are two main parameters which impact a normal distribution and they are mean and the standard deviation of the sample
The normal curve shows the probability distribution for continuous random variable and the curve is bell-shaped. The graph of the probability density function of the normal distribution is symmetrical about the mean and it is called Normal Probability Curve.
Normal distributions become more perfect for finer level of measurement and larger sample.
The mean of the sample for the normal distribution creates the symmetry on its both sides so that the right side of the centre is a mirror image of the left side.
The probability density function of the normal distribution is $f\left( x \right)=\dfrac{1}{\sigma \sqrt{2\pi }}{{e}^{-\dfrac{1}{2}{{\left( \dfrac{x-\mu }{\sigma } \right)}^{2}}}}$ where $\mu $ is the mean and $\sigma $ is the standard deviation of the sample.
Note: Normal curve has great significance in social sciences and behavioural sciences. In behavioural measurement most of the aspects approximate to the normal distribution. The normal curve is unimodal.
Recently Updated Pages
Master Class 11 English: Engaging Questions & Answers for Success
Master Class 11 Social Science: Engaging Questions & Answers for Success
Master Class 11 Maths: Engaging Questions & Answers for Success
Master Class 11 Biology: Engaging Questions & Answers for Success
Master Class 11 Physics: Engaging Questions & Answers for Success
Master Class 11 Chemistry: Engaging Questions & Answers for Success
Trending doubts
One Metric ton is equal to kg A 10000 B 1000 C 100 class 11 physics CBSE
Difference Between Prokaryotic Cells and Eukaryotic Cells
Two of the body parts which do not appear in MRI are class 11 biology CBSE
Find the value of the expression given below sin 30circ class 11 maths CBSE
Draw a diagram of a plant cell and label at least eight class 11 biology CBSE
10 examples of friction in our daily life